Policymakers/Government

Debating reform? Benchmark your zoning before the vote.

Zoning decides what gets built and where. But it's effectively unreadable at scale: thousands of jurisdictions, each with its own code and decades of amendments. Legislators debate reform without knowing how their rules compare to the state next door, and reforms pass with no baseline to measure them against. Land Use Labs turns sprawling local codes into standardized data so you can benchmark your community and target reform with evidence instead of anecdotes.

Explore what our data is built for
Due Diligence
Before acquiring a property, know exactly what zoning rules apply. A Parcel Report gives you districts, allowed uses, and dimensional requirements for any address in minutes.
Development Feasibility
Quickly assess whether a site can support your intended use — housing type, building size, parking minimums — before investing in full plans.
Conformity Analysis
Determine whether an existing structure or use complies with current zoning. Essential for property sales, refinancing, or legal review.
Risk Mitigation
Catch zoning issues early — nonconforming uses, overlay restrictions, special permit requirements — before they become costly surprises.
Zoning Reform
Support zoning code rewrites by seeing exactly how each district regulates density, uses, and dimensional standards.
Map Display
Show zoning district layers as they appear in codes in static and interactive maps for internal and external audiences.
Regulatory Comparison
Investigate how different cities, counties, and towns treat zoning districts.
Data Integration
Quickly overlay which residential and nonresidential uses are allowed against your own data.
City and Regional Planning
Inform high-level planning decisions about siting, growth, infrastructure investments, and more, with standardized data.
Environmental Analysis
Examine how allowed uses overlay with flood zones, fire hazard severity zones, areas with heat exposure, tree canopy coverage, topography, and more.
Land Use Research
Explore how zoning rules shape development patterns, land conservation, and environmental quality in different places.
Policy Research
Investigate trends around single-family prominence, missing middle housing, ADU adoption, and more.
Geospatial Visualization
Display zoning regulatory outcomes as clean, non-overlapping polygons as you conduct internal analysis.
Scenario Planning
Model the impact of zoning proposals or decisions by comparing Slice outcomes before and after different scenarios.
Site Selection
Filter by the exact combination of zoning outcomes you need — permitted uses, minimum lot sizes, height caps — across any geography, at scale.
Cross-Geography Comparison
Compare zoning rules on density, parking, and uses side by side across your selected geographies.
Data Visualization
Use data for maps and charts ready for reports, presentations, or public-facing dashboards.
Housing Research
Quantify how zoning shapes housing supply by comparing rules with demographic and market data to study affordability, density, and development trends.
Demographic Cross-Tabs
Cross-reference zoning categories with census and demographic data to analyze who zoning rules affect, and where.
Regulatory Summaries
Generate plain-language breakdowns of complex zoning codes for fast reference.
Find the right product

Make Informed Policy with Zoning Districts

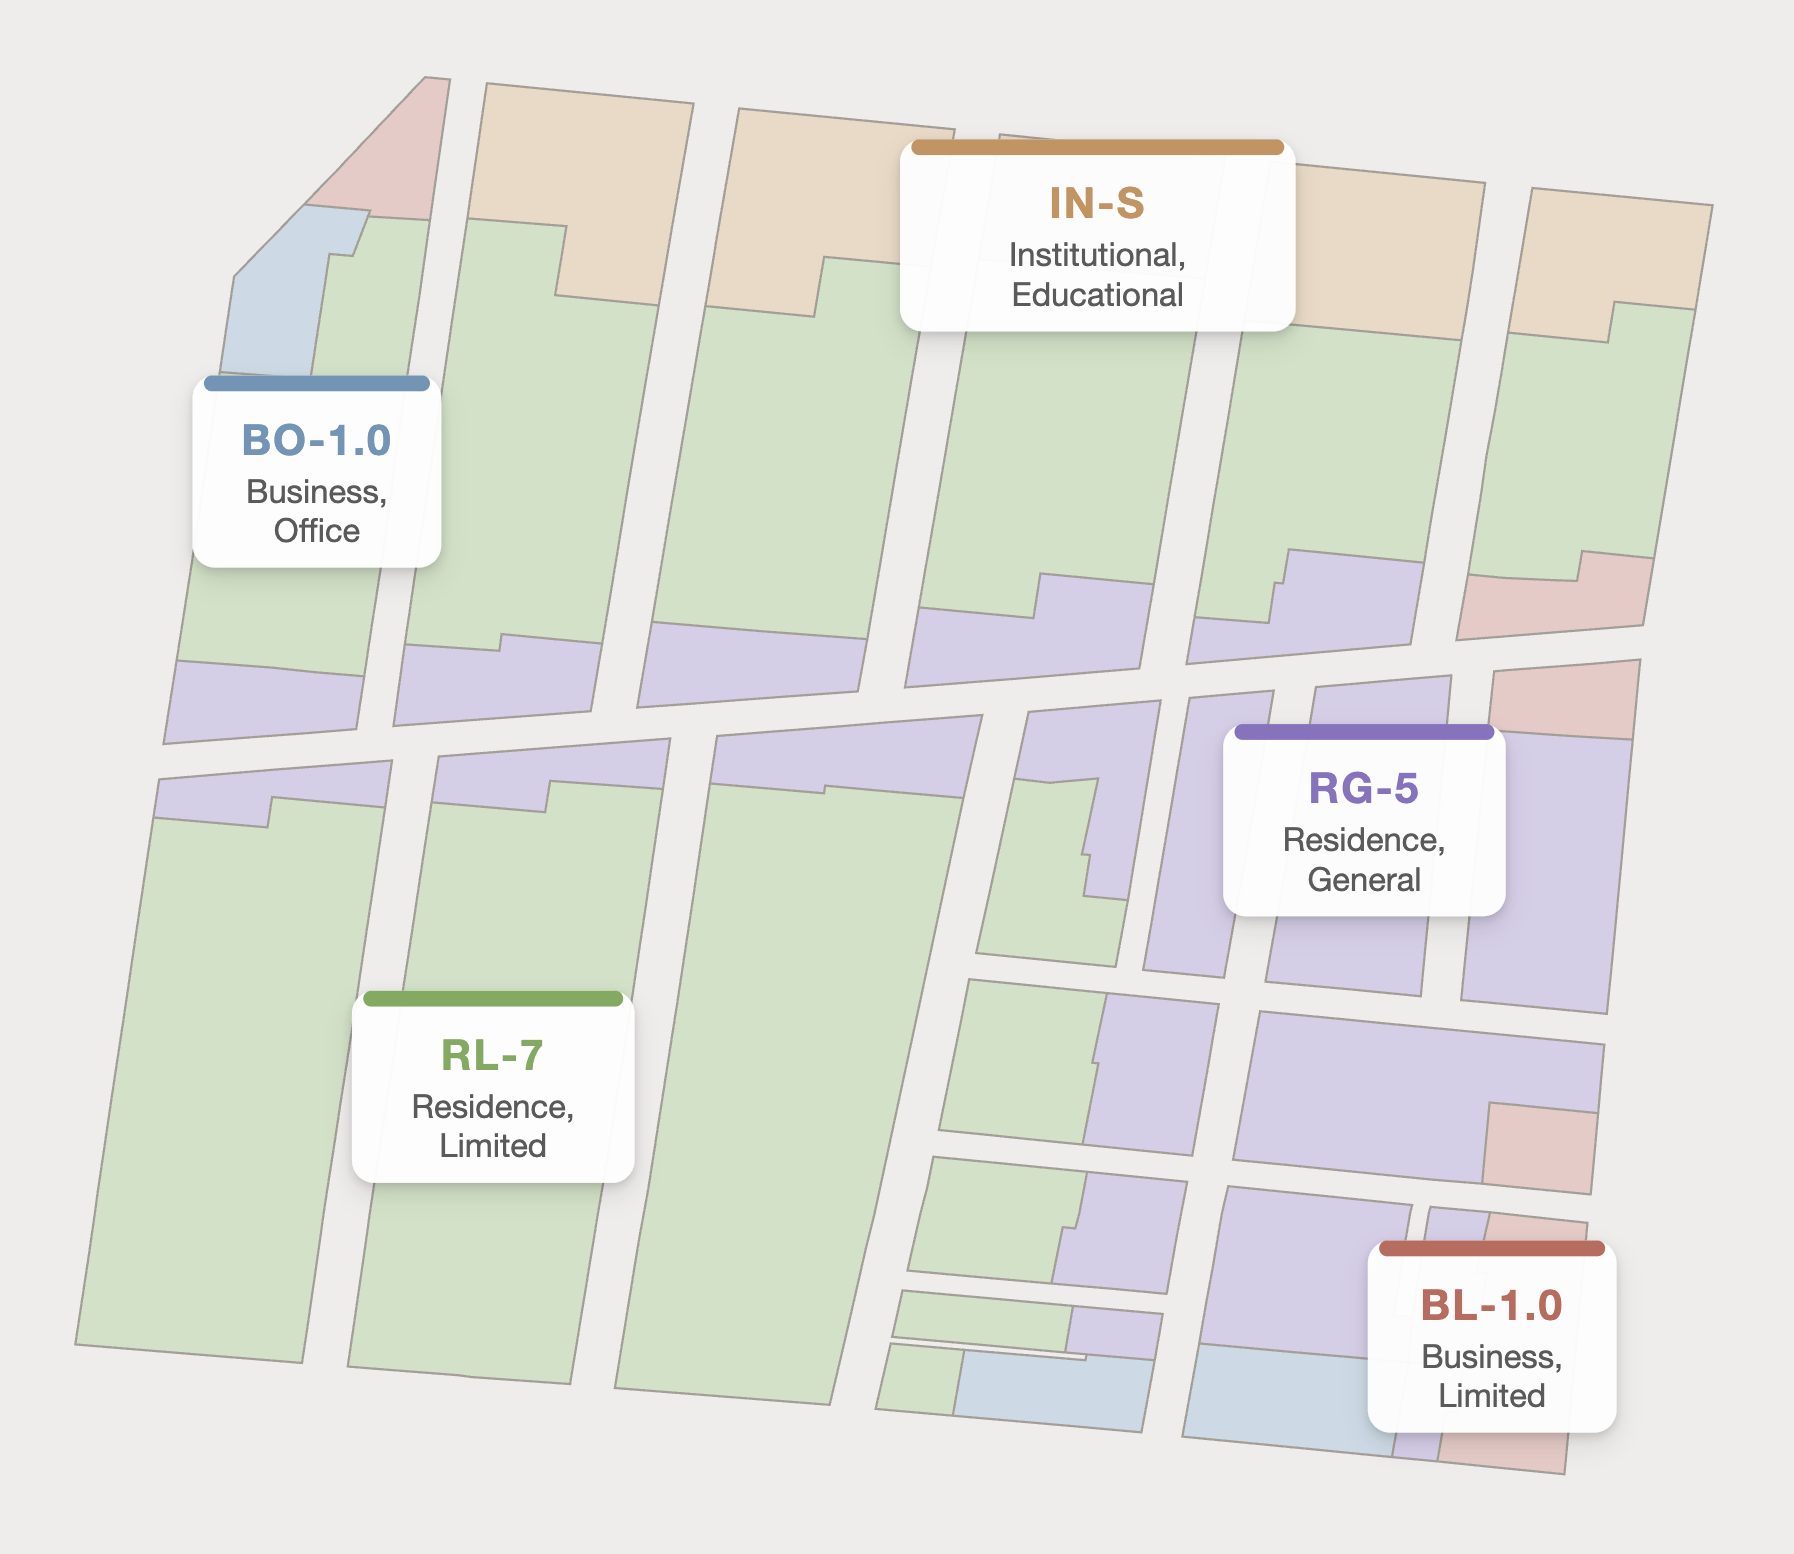
GIS layers that reveal how each base and overlay district regulates uses and lots. Drop them into your GIS to see where constraints bind, model zoning reform before it goes to council, and compare regulations across districts. Public display of your zoning is available under a custom license.
Compare Your Jurisdiction with Zoning Tables

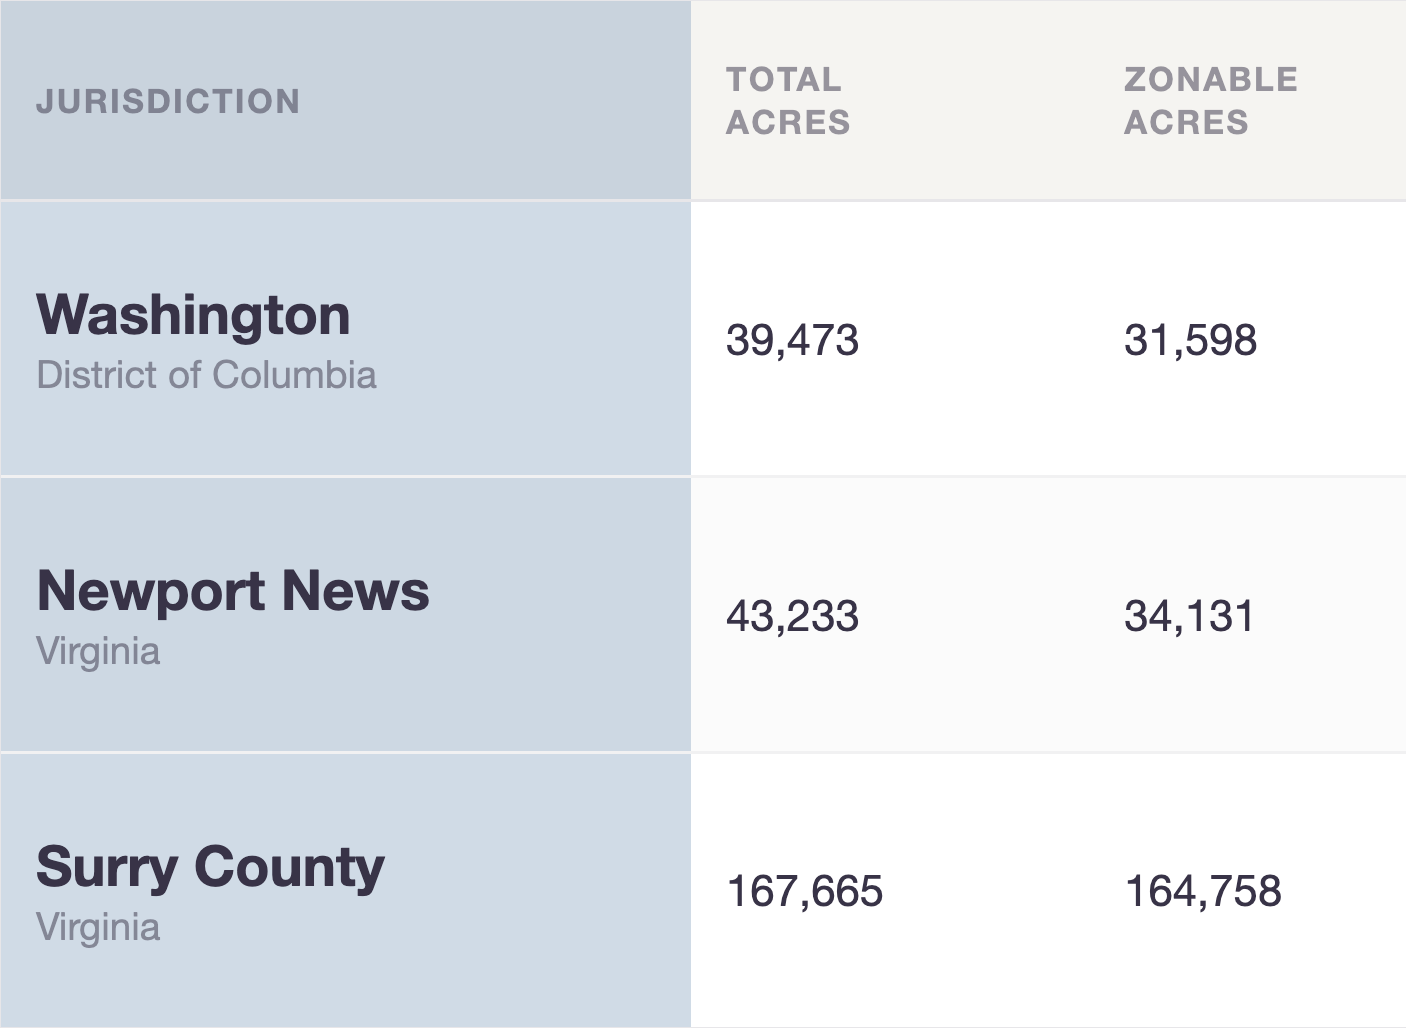
Summary statistics on zoning, housing, land cover, and demographics at any scale, from a single jurisdiction to an entire state or CBSA. They power regulatory comparison and land use research, using hard numbers to make the case for zoning reform.

Model Reform Scenarios with Zoning Slices

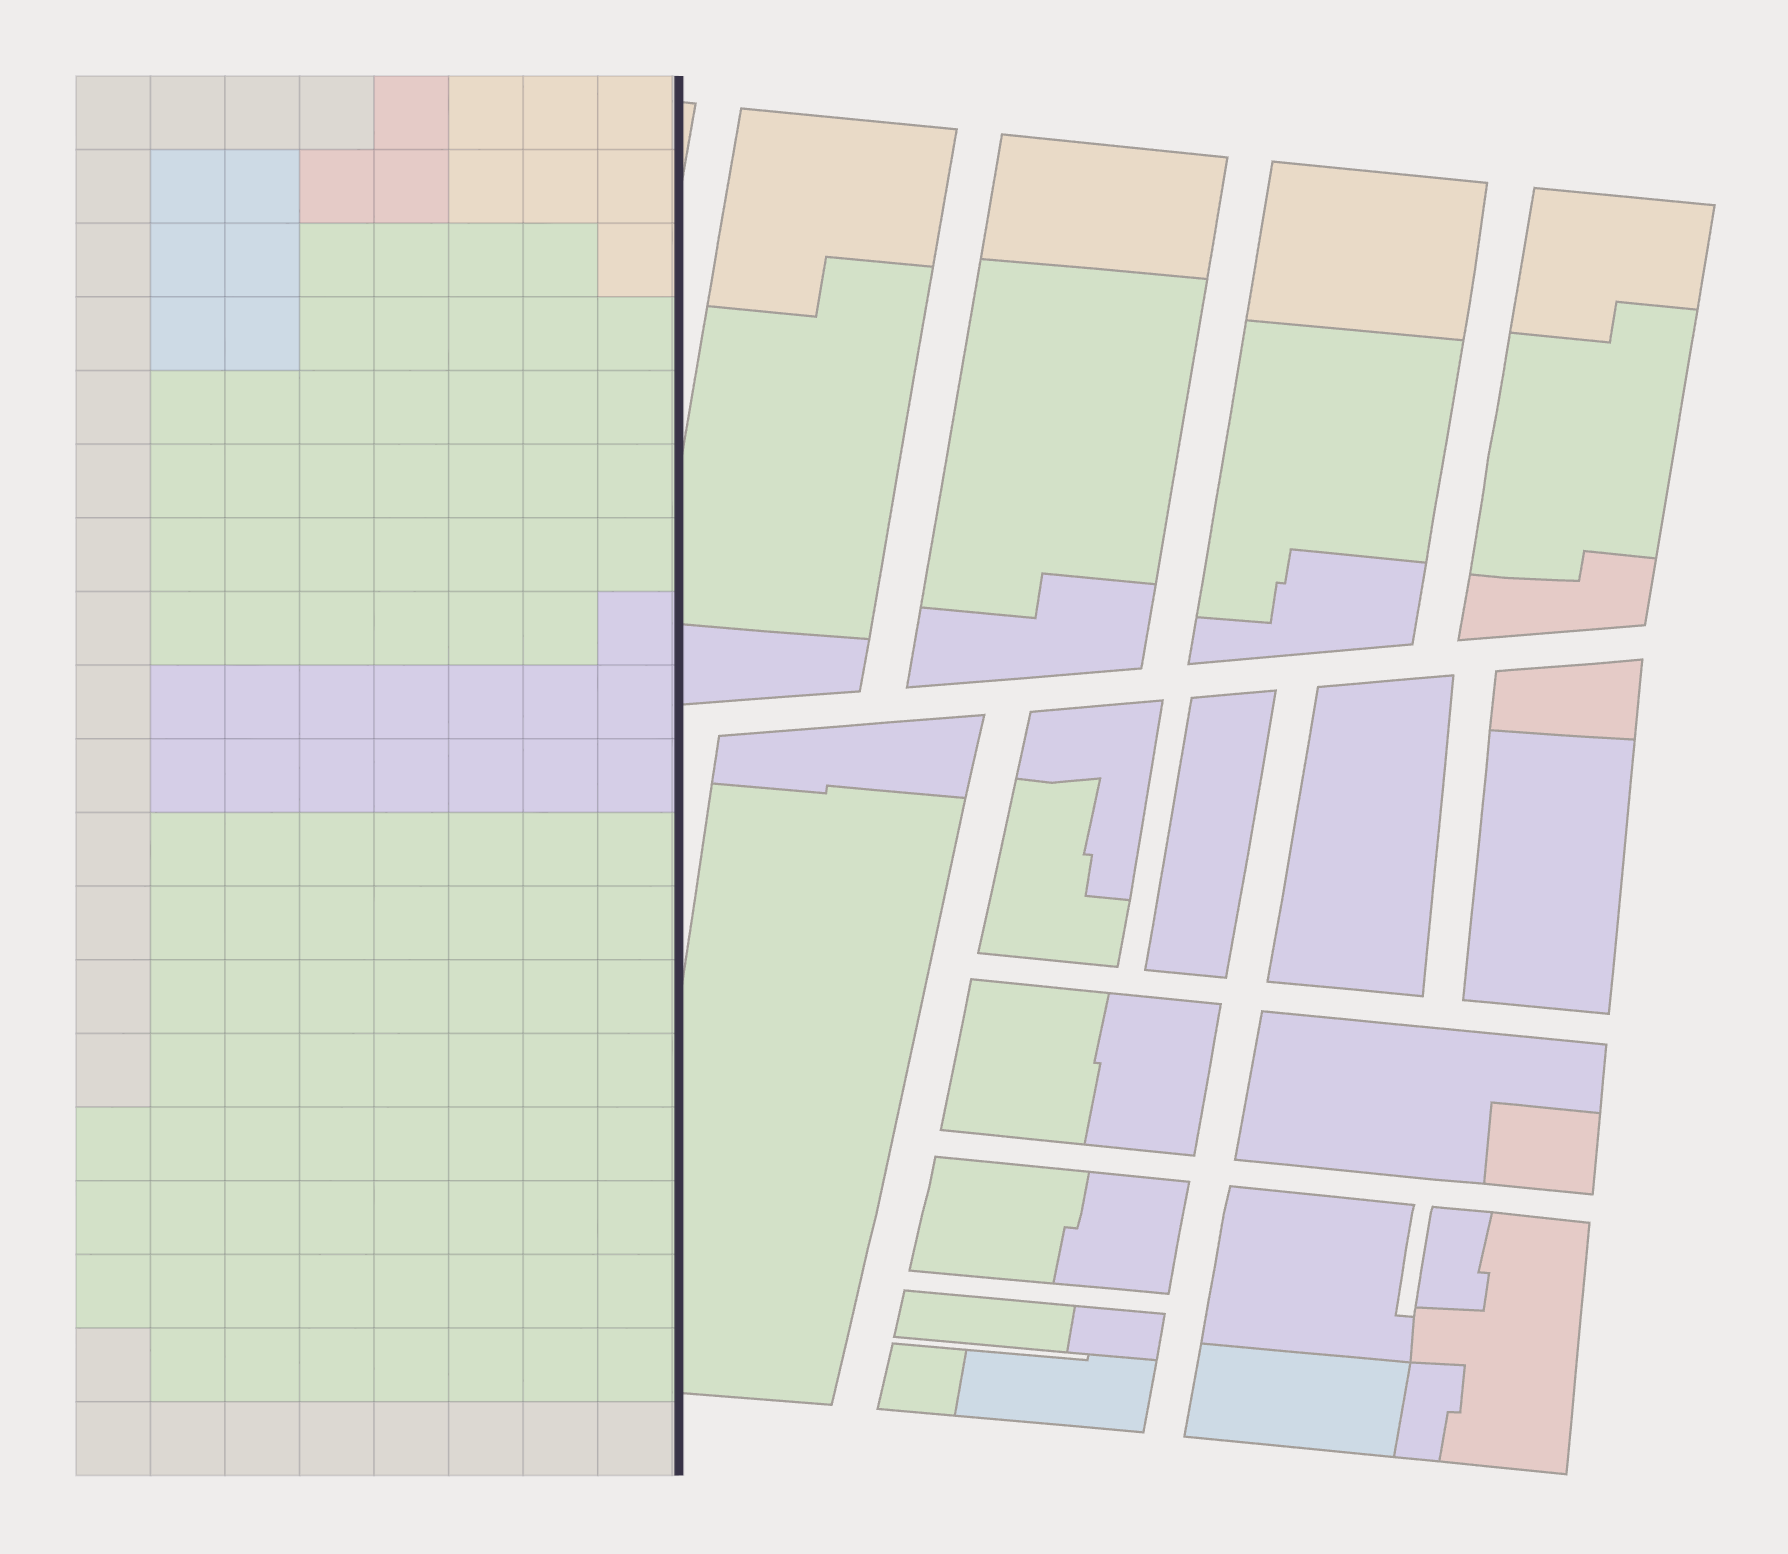
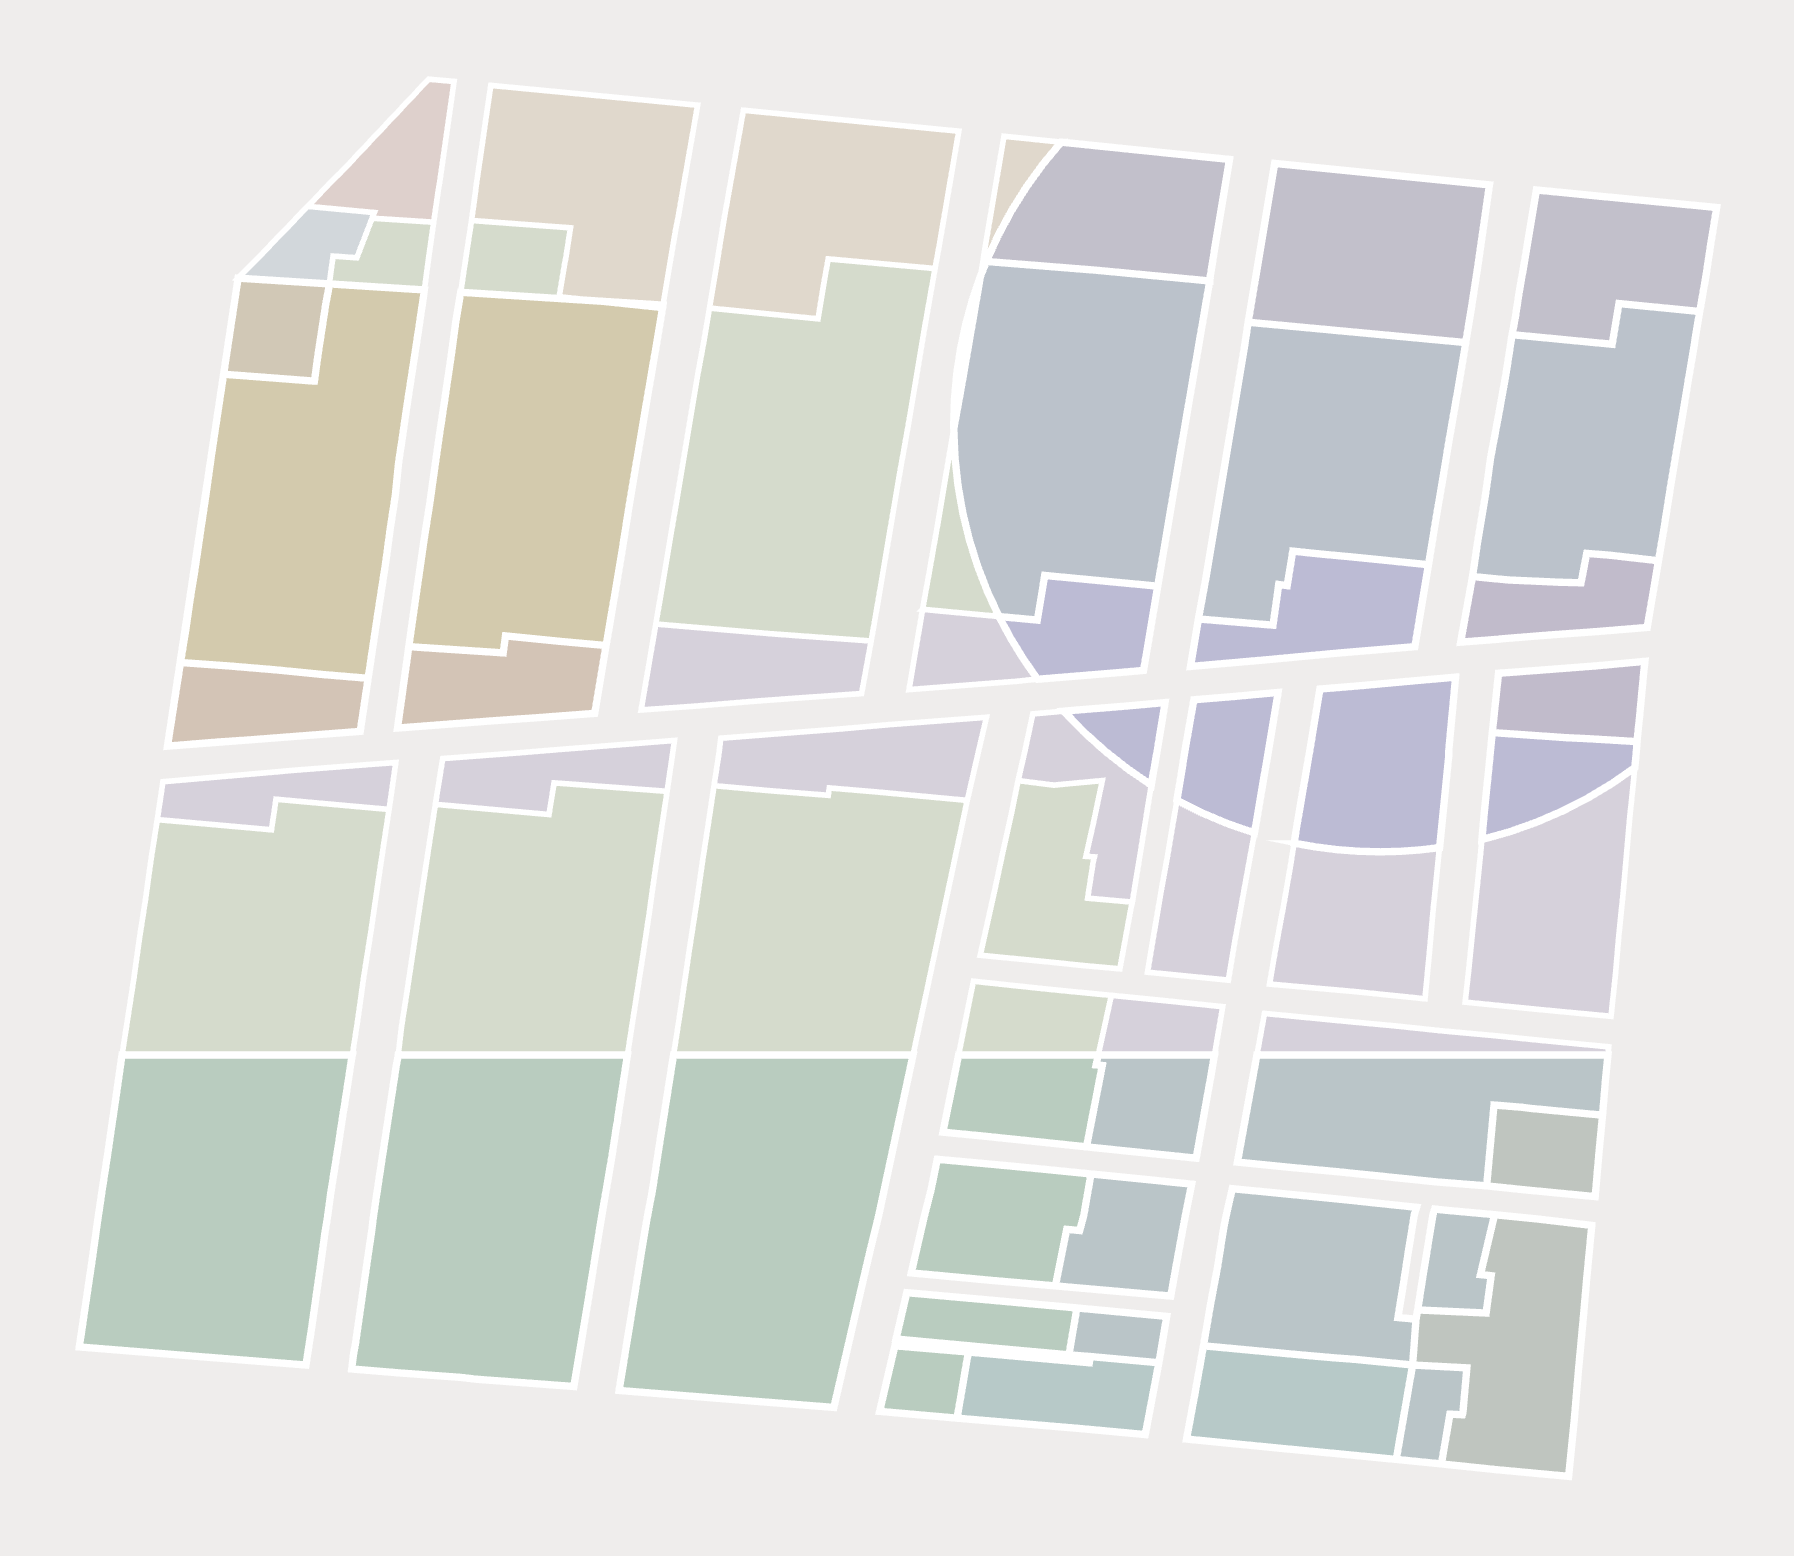
Slices flatten every overlapping base and overlay district into individual, non-overlapping polygons, each carrying exactly one set of prevailing rules. They show what zoning actually requires across a whole study area, ready for scenario planning and policy research.
See What's Buildable with Zoning Rasters

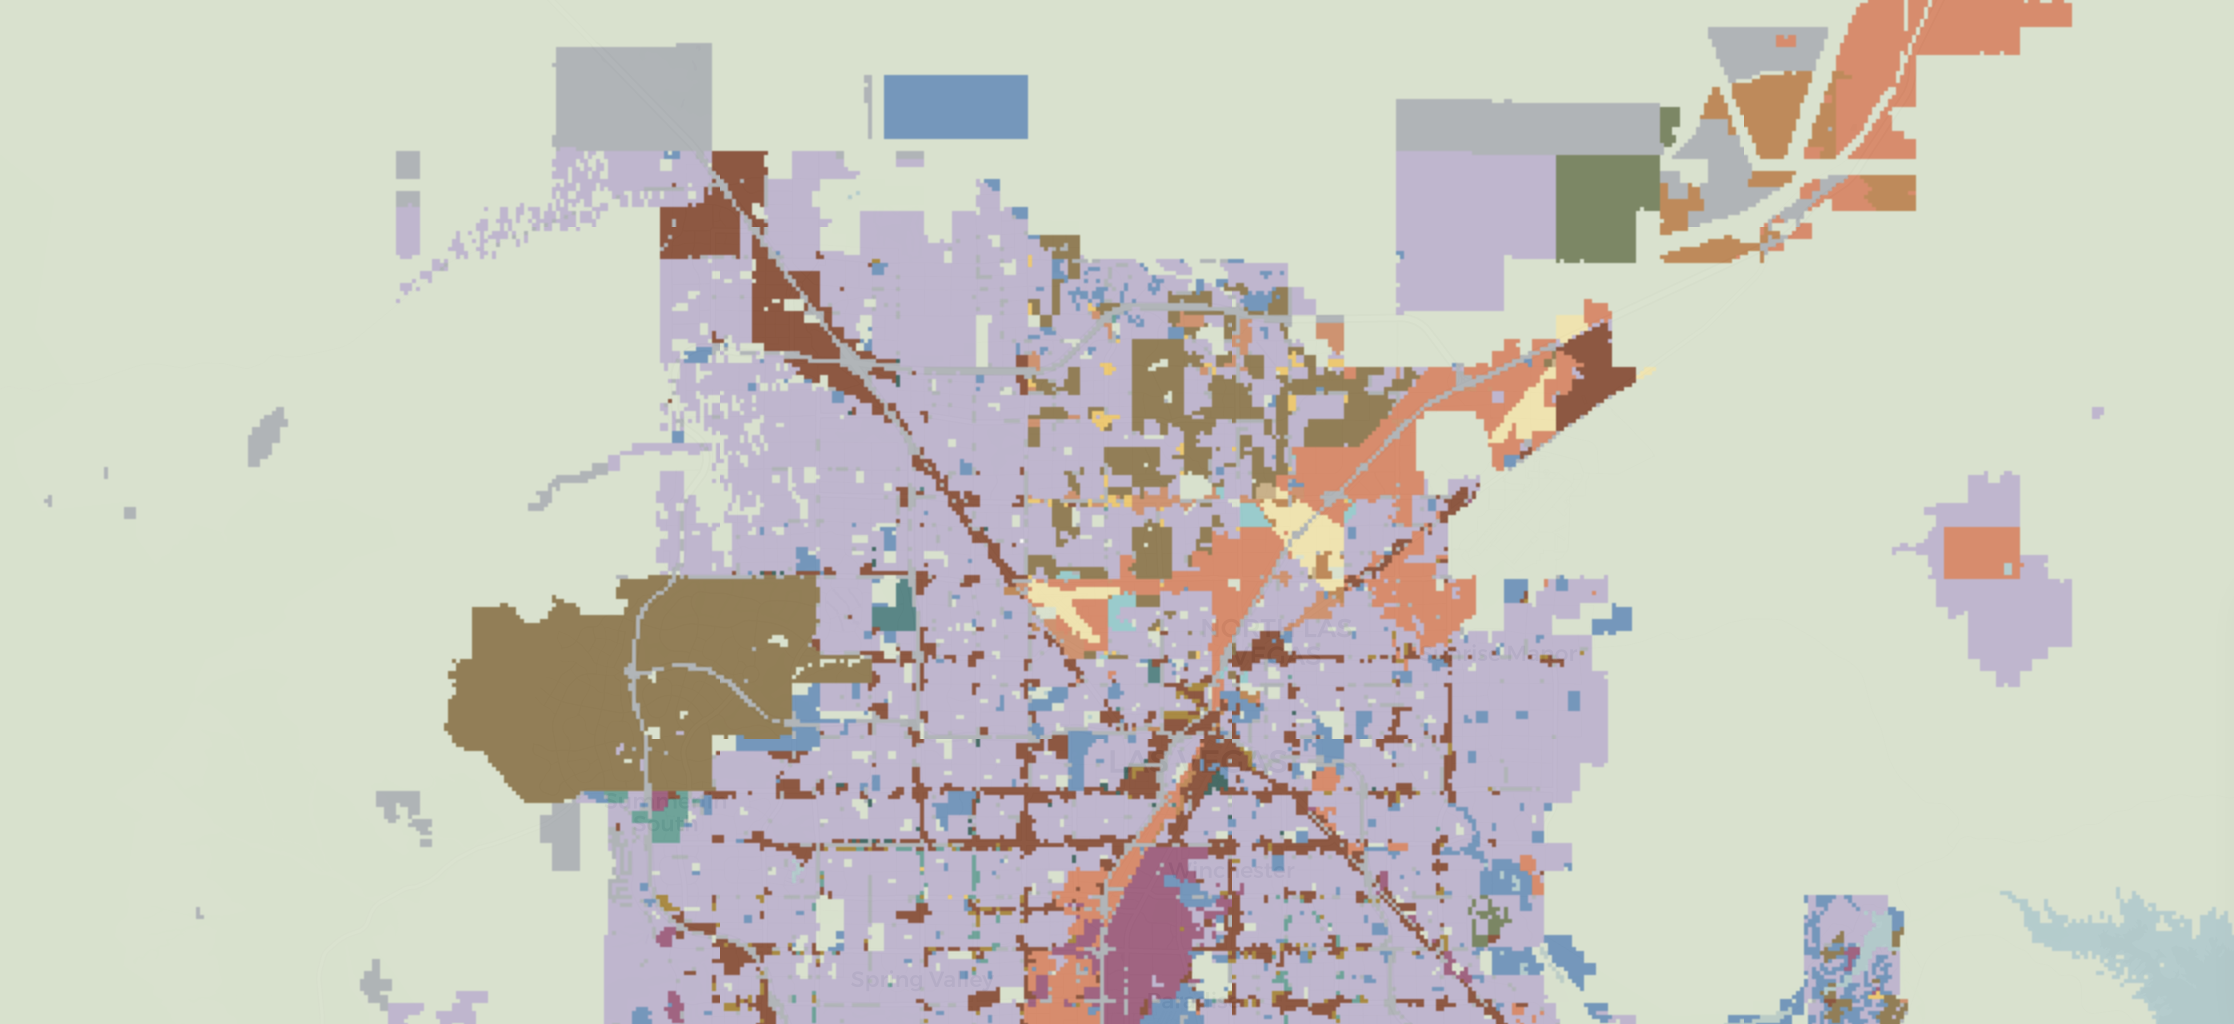
A standardized 30×30m grid of allowable residential and nonresidential uses across a billion-plus acres, a continuous surface of what zoning permits rather than what's already built. Rasters suit environmental analysis and land use research, and integrate directly with your own data pipeline.

Need Custom Analysis?

When an off-the-shelf dataset isn't enough, our team builds tailored studies, from reform scenarios to buildout-capacity and impact analyses.

You bring the question; we handle the analysis.

Long live accessible zoning
for everyone.

By licensing our data,
you support the National Zoning Atlas.
Learn More.