
Get the tools you need to plan your places.
Planners know what good zoning data looks like—and how rarely it exists. At Land Use Labs, we’ve done the time-consuming work of cleaning and reconciling zoning data, so you can focus on your community. Online orders for our products are delivered the same day.
Find the right product.
Select the option closest to your need to see which product fits.
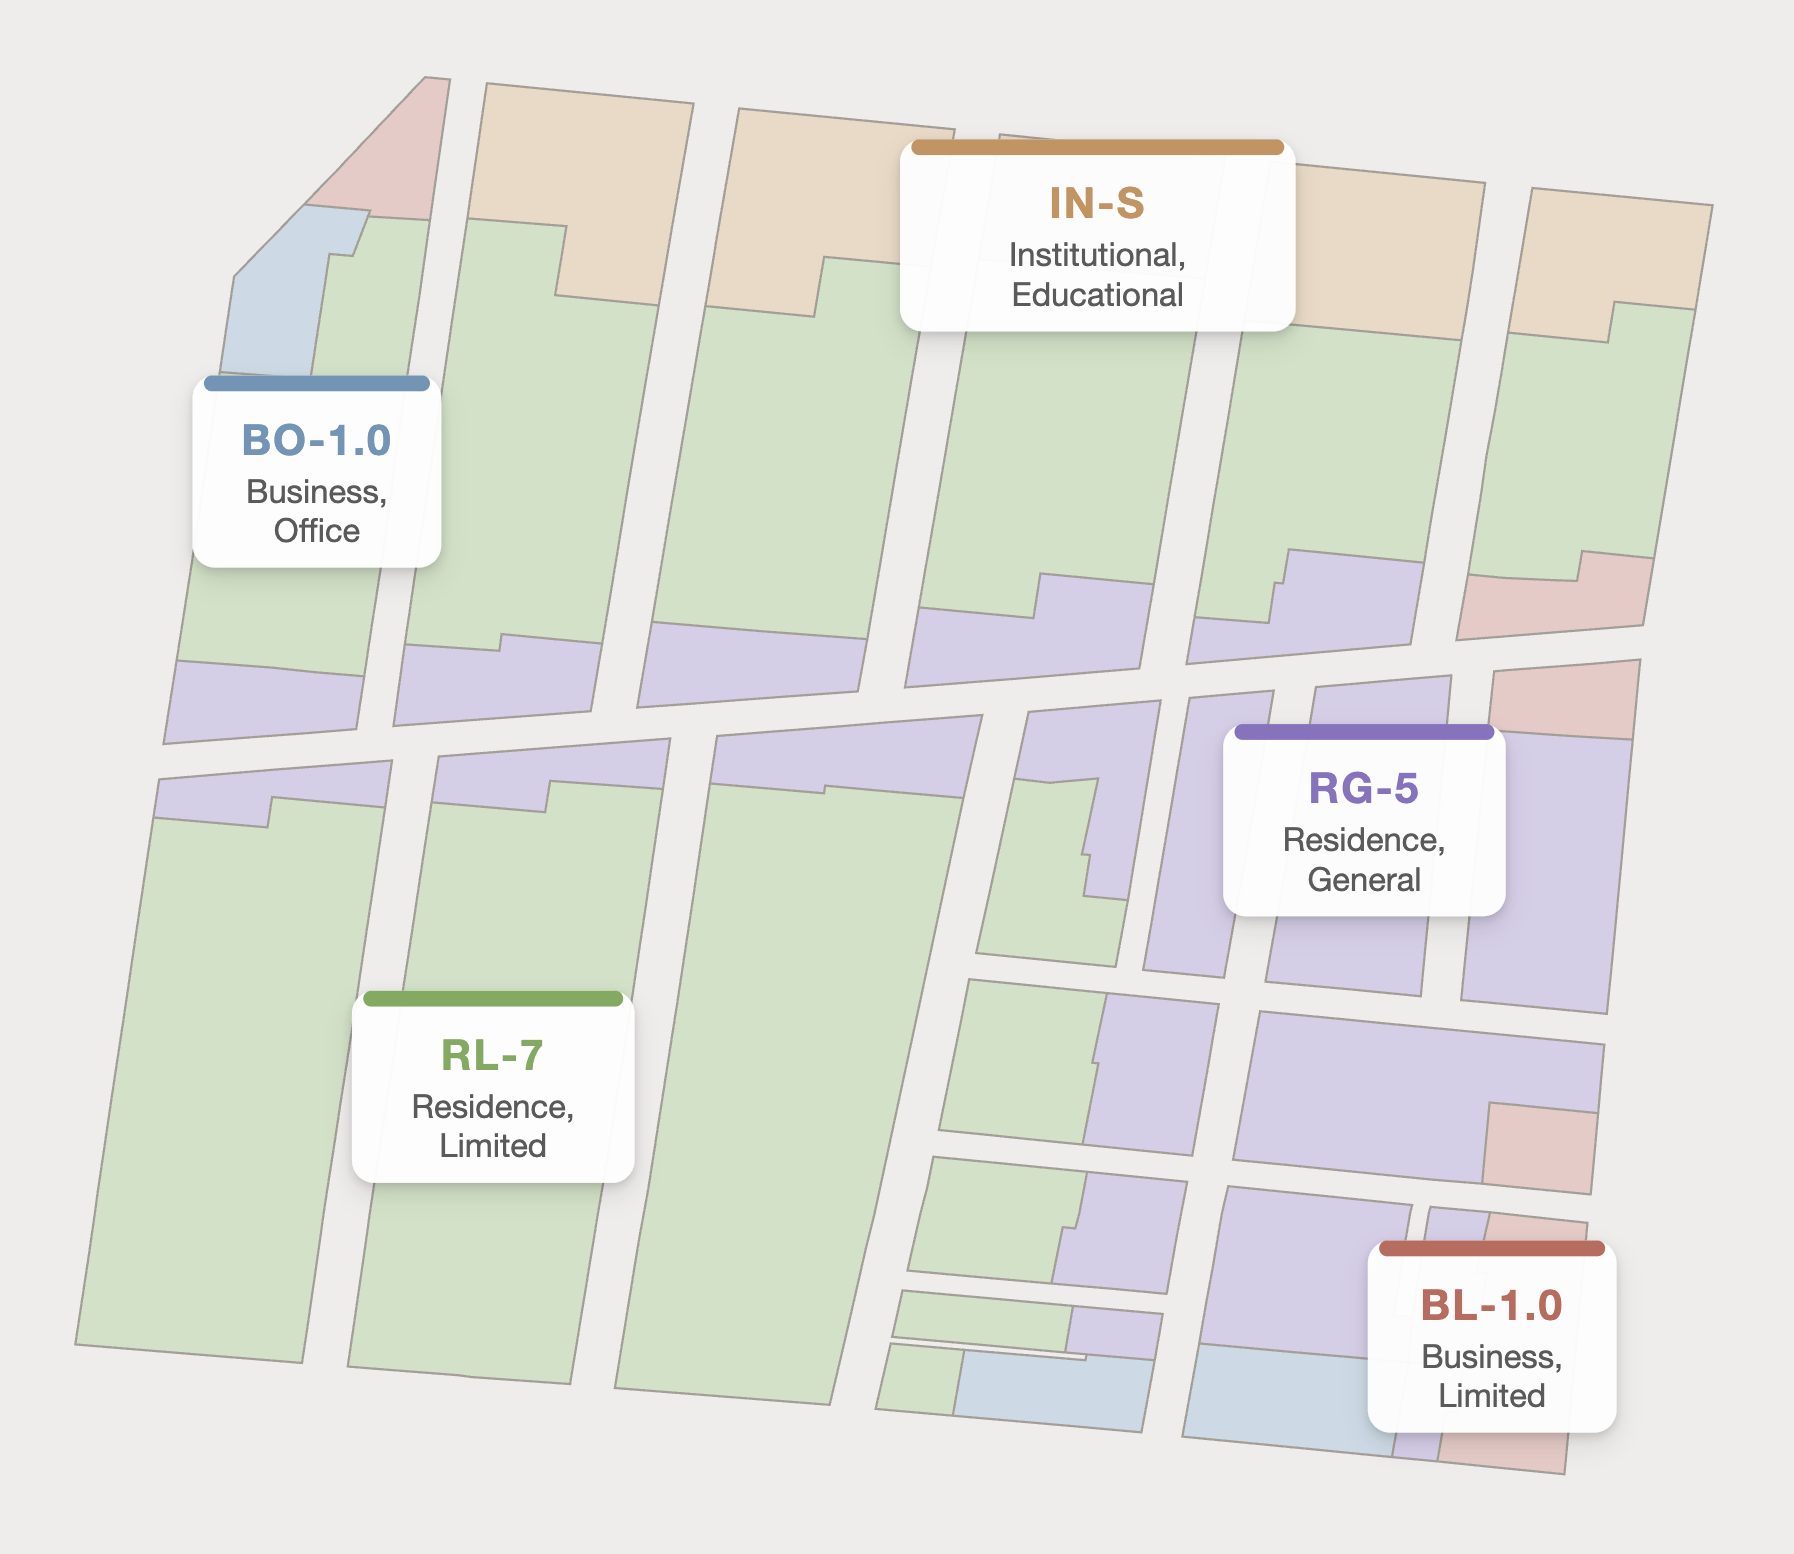
Get clean zoning GIS with Zoning Districts
Zoning Districts show how each base and overlay district regulates uses, structures, and lots—direct from the zoning code. All our code interpretation is done by human experts, not web scrapers or agents. With Zoning Districts, you can see district boundaries, model rezonings, and compare your zoning to your neighbor’s zoning. Need public display? Contact us for a custom license.
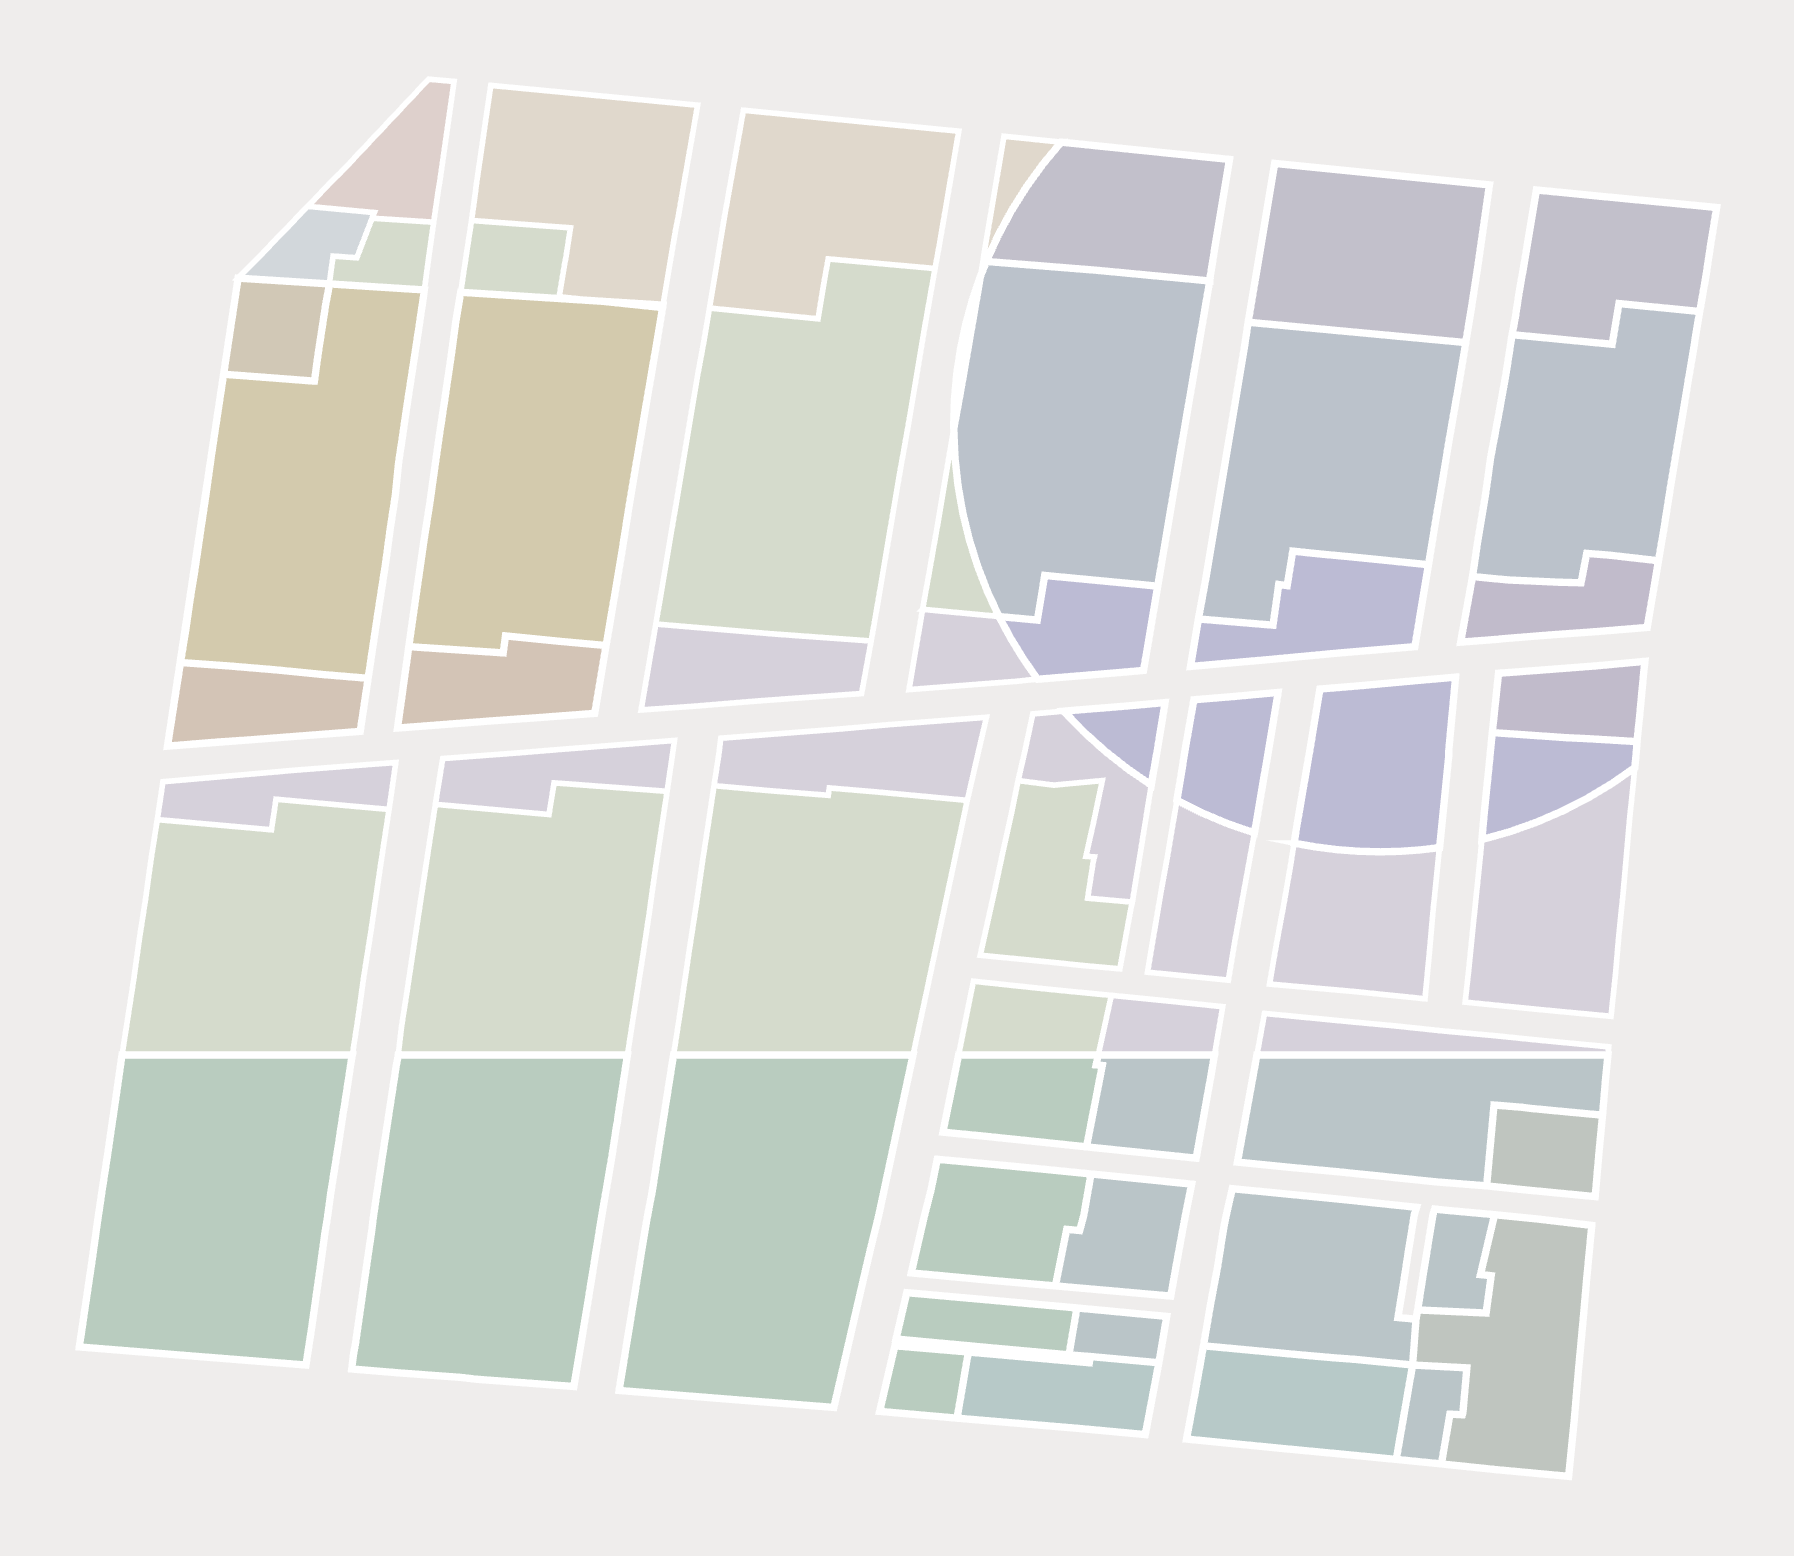
See which rules prevail with Zoning Slices
Slices flatten every overlapping base and overlay district into non-overlapping polygons, each carrying exactly one set of prevailing rules. Resolving that overlay logic is the part that eats the schedule when you do it in-house. We hand you the finished geometry—what zoning actually requires—ready for buildout capacity analysis or testing a reform before it goes public.
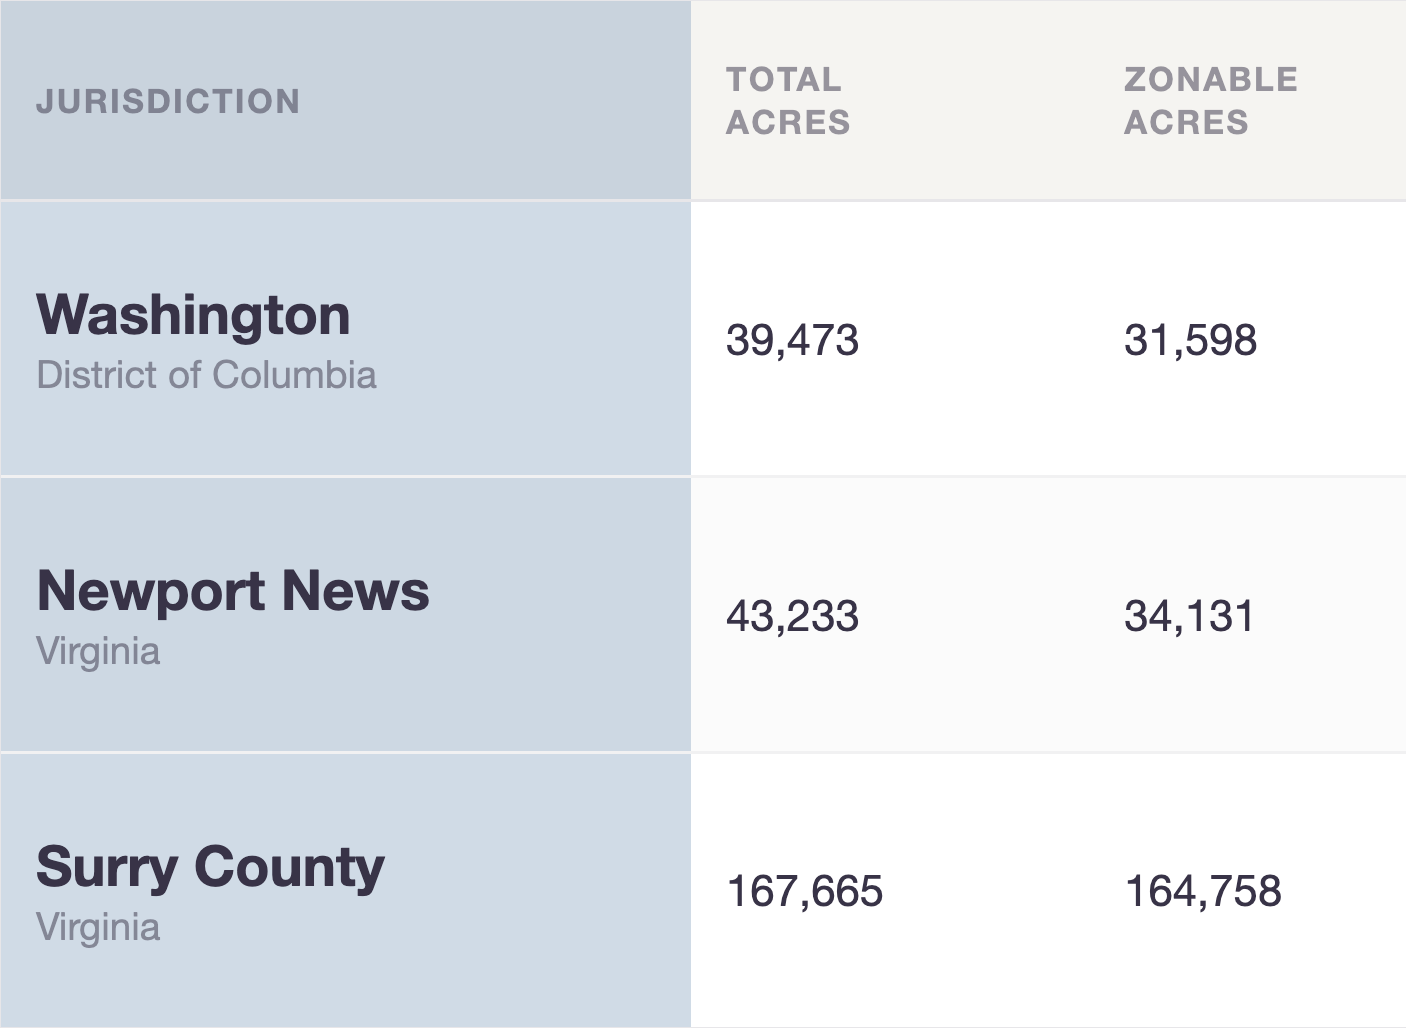
Benchmark your zoning with Zoning Tables
Zoning Tables summarize statistics on zoning, housing, land cover, and demographics at standardized geographies available on demand for a single jurisdiction, county, CBSA, or entire state. Because every place is encoded to the same schema, the comparison holds: show your council and commission how local standards stack up against peer communities, with hard numbers instead of anecdotes.
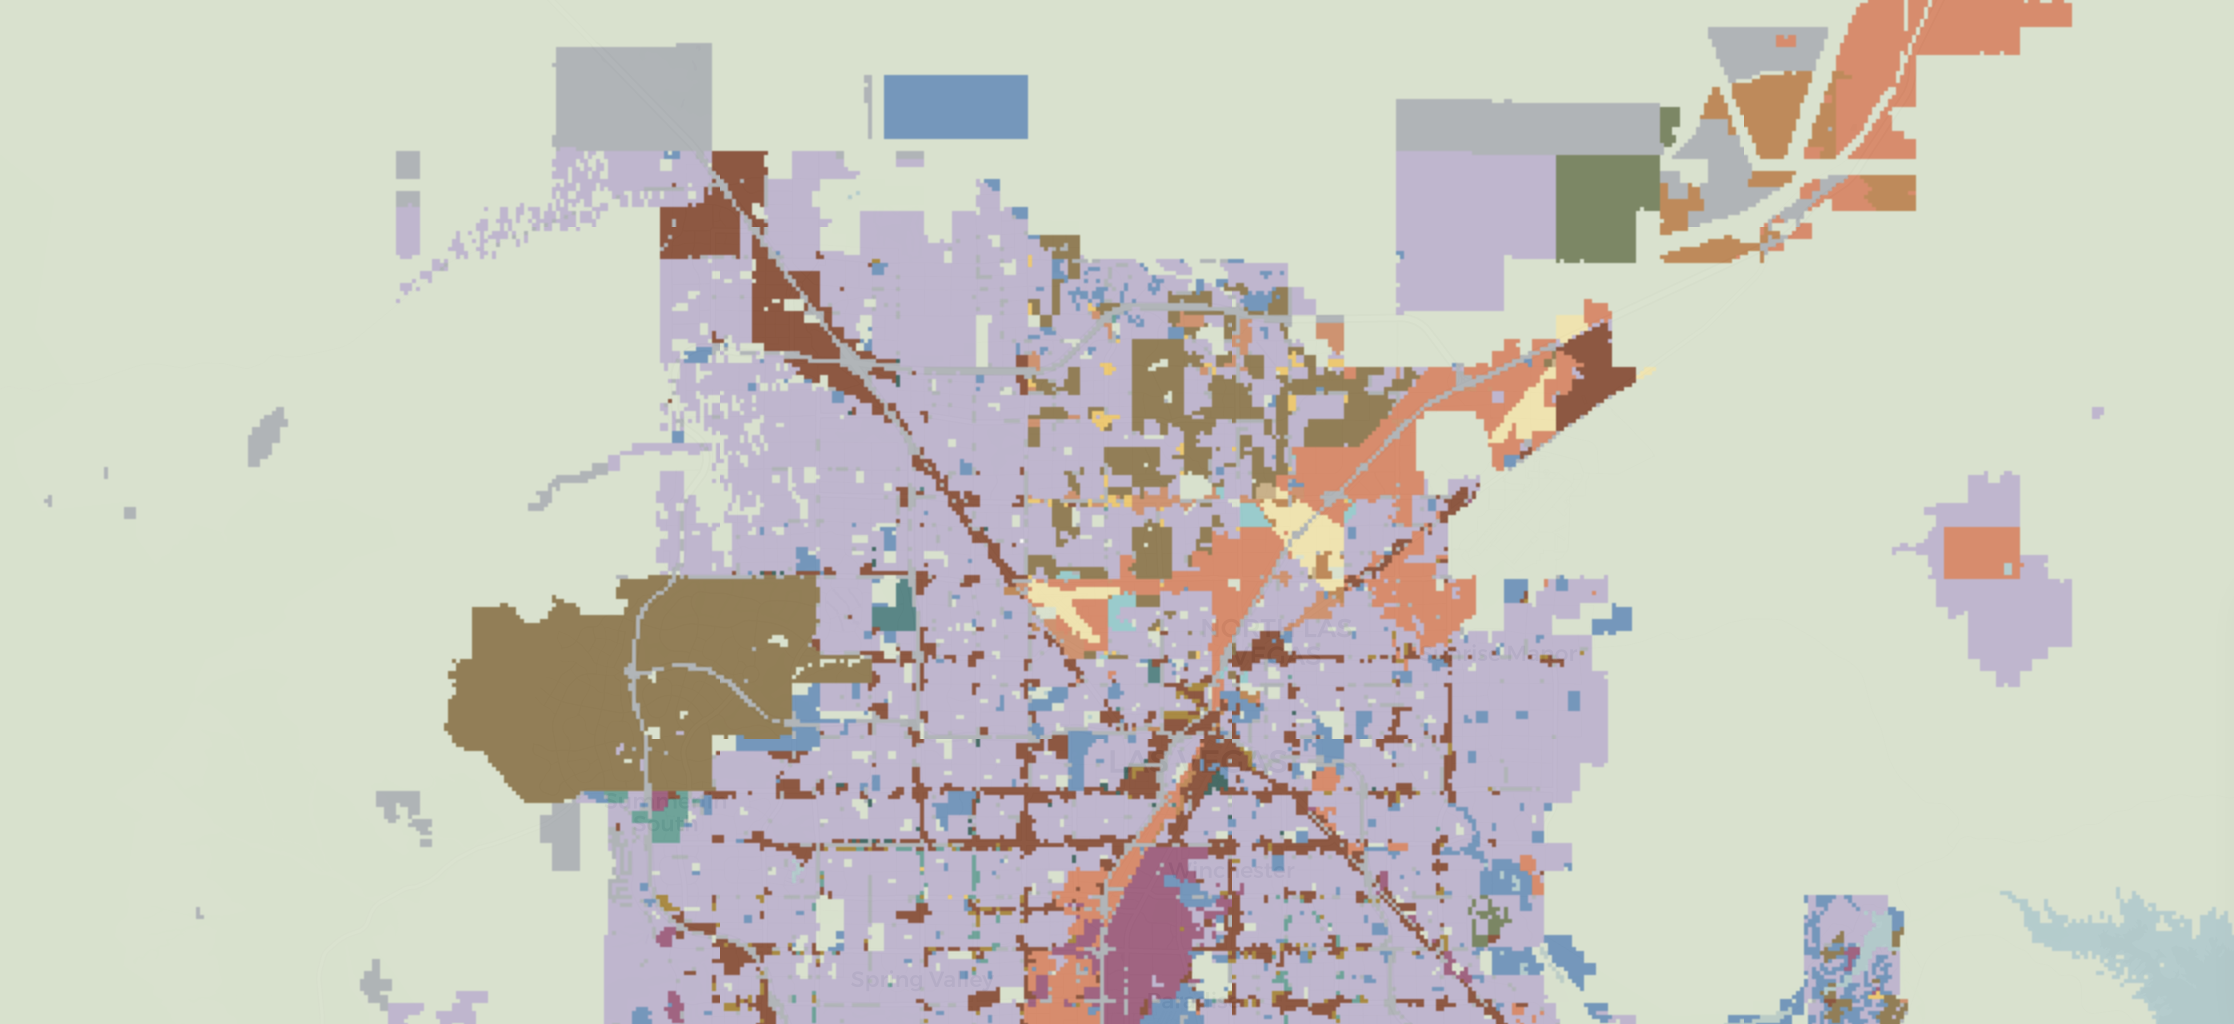
Need custom analysis?
When an off-the-shelf dataset isn't enough, our team conducts tailored analysis: regulatory baselines for a defined study area, multi-site suitability and constraint screens, and geospatial computation at any scale.