
The Industry’s Most Accurate and Comprehensive Data
After analyzing 1.4+ million pages of zoning text across 96+ million parcels, Land Use Labs has the expertise needed to catch what other data providers miss.
Triple-Vetted Methodology
Our motivation, like yours, is knowledge: we started collecting zoning data to inform the public and support reform — and that’s still our goal. So for us, there are no shortcuts. We’re committed to accurate information, analyzed and delivered with integrity.
Every data point is collected following these three principles.
Direct Code Sourcing
Our analysis is rooted in official zoning codes - the texts and maps published by local jurisdictions. We don’t draw from assessors’ maps, third-party aggregated data, or other unreliable, unofficial sources.
Human Verification
Our dataset is created, verified, and updated by human experts, not AI. Every entry undergoes a multi-step review process by team members with expertise spanning law, geography, planning, and data science.
Regular Update Cycles
Recognizing the value of refreshed zoning data, we continuously monitor, track, and input updates, and we regularly conduct full-state and full-metro area reviews.
Our products are built from three fundamental components.
Generating Jurisdictions, Zoning Districts, and Zoning Slices in a consistent manner using a rigorous methodology has enabled us to capture with unprecedented precision how zoning actually works across the United States — use by use, lot by lot, structure by structure.
Jurisdictions
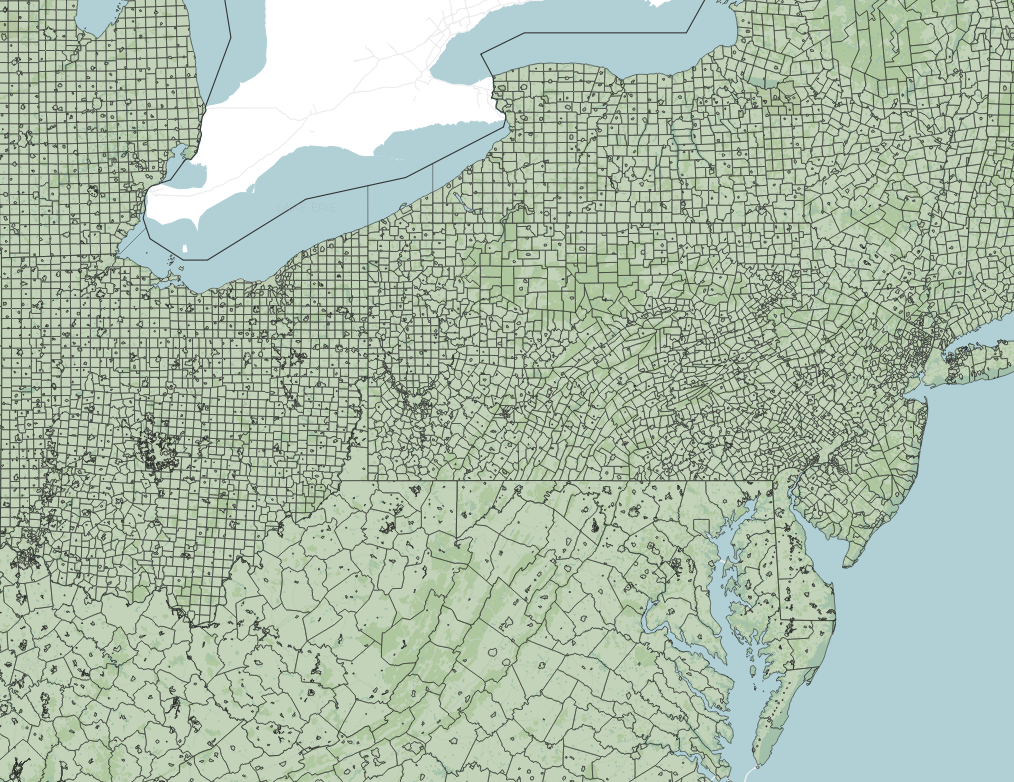
Our team has created the first and only comprehensive dataset identifying all 33,000+ jurisdictions with zoning authority — complete with their geographic boundaries, population and housing unit counts, and land cover statistics.
Our analysts locate and analyze the rules for each jurisdiction, one by one. We update jurisdiction boundaries (GIS) in line with the U.S. Census, and we also log exercises of extraterritorial jurisdictional authority and piecemeal annexations.
Zoning Districts
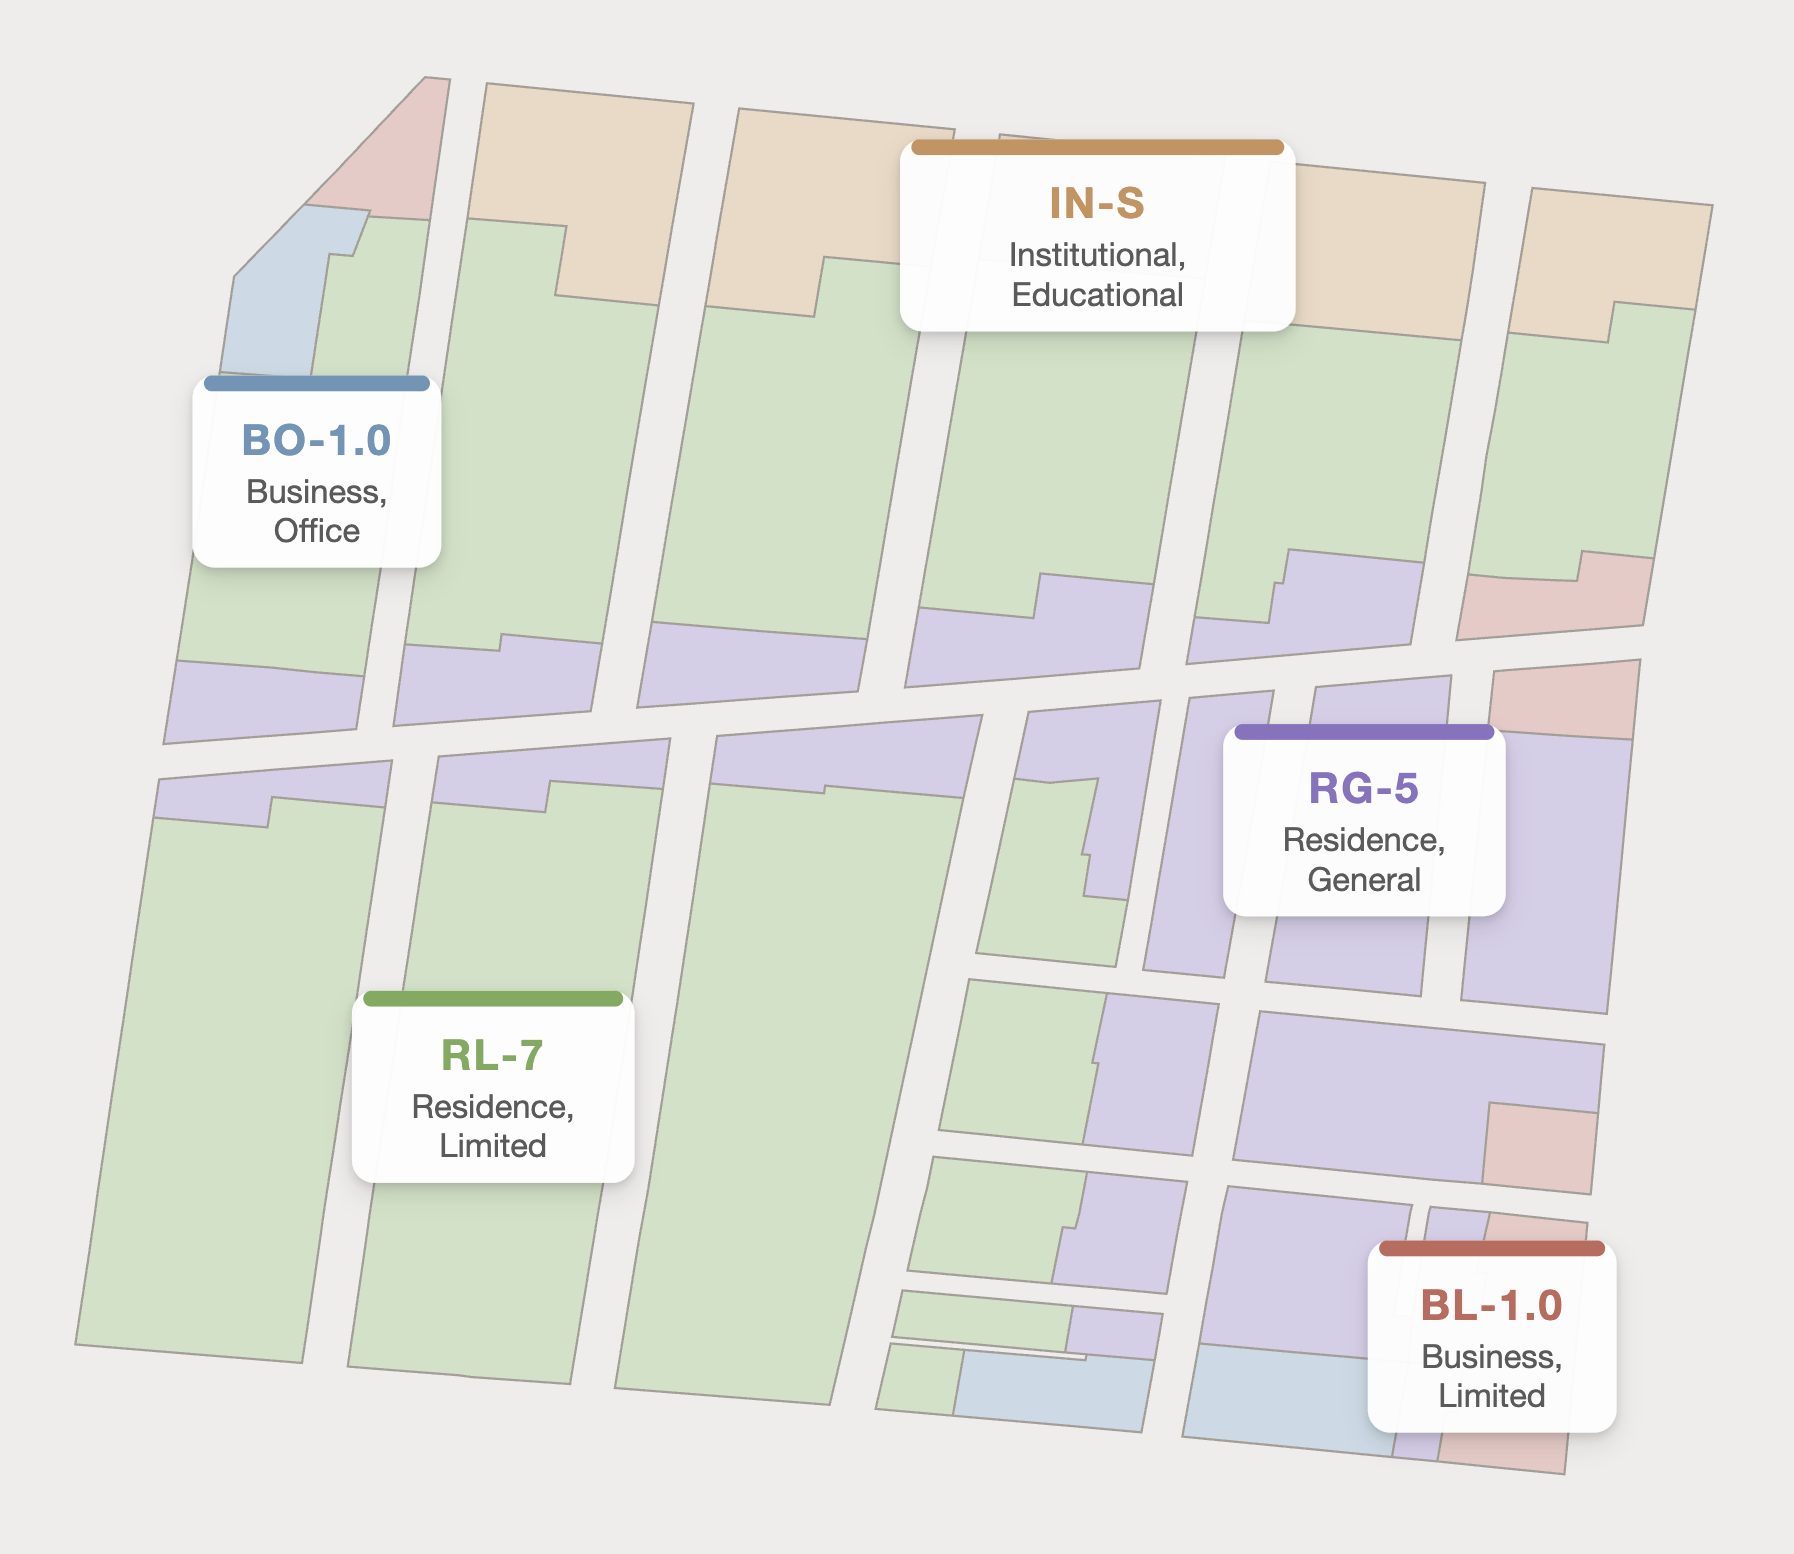
For each jurisdiction, our analysts identify and analyze zoning districts: defined, regulated areas within (and sometimes outside) the city, town, county, or other type of jurisdiction administering the zoning code.
Our team carefully reviews both the map and text of the code. We digitize and spatially align district boundaries, and we encode regulatory attributes specifying use, lot, and structure requirements into our structured data schema. Throughout, we use a standardized methodology designed to translate complex local regulations and maps into consistent, comparable outputs.
Zoning Slices
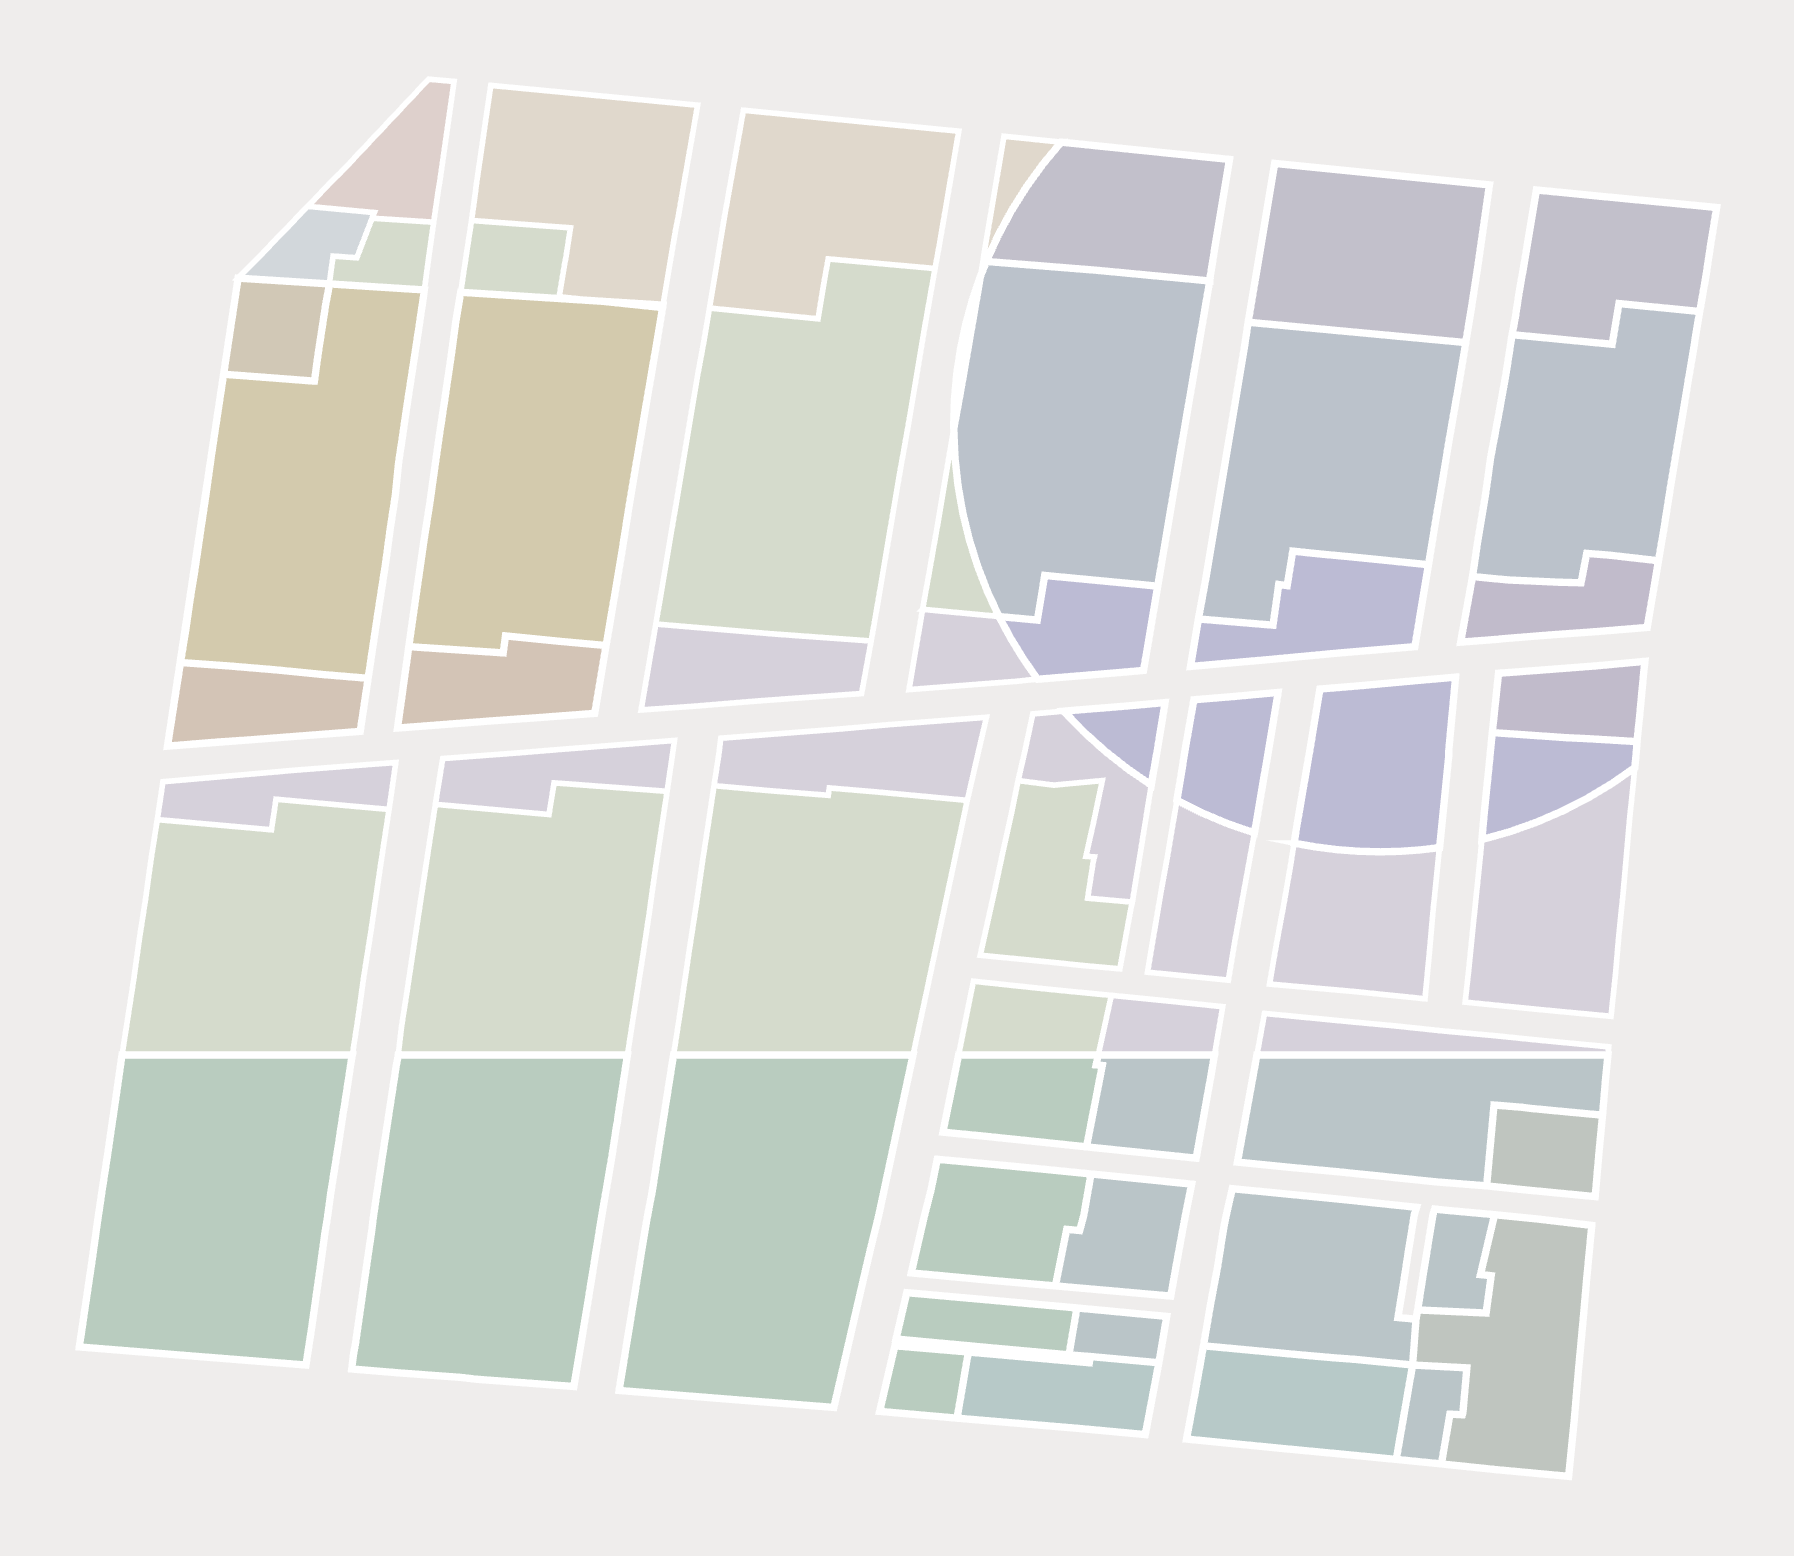
As we review zoning districts, we classify them as base districts and overlay districts - and we recognize the complexities that can arise when two or more sets of regulations apply to the same piece of land at once.
Zoning Slices are Land Use Labs’s solution to this problem. We create Slices - unique geometric combinations of base and overlay districts - by applying our tested processes to show regulatory outcomes. The output appears like a stained-glass mosaic, where each Slice represents a distinct set of zoning rules that apply to the underlying land.
We’re award-winning researchers who can spot data slop a mile away.
We are leading efforts to hold zoning data providers accountable for their false claims. In three papers (totaling nearly 50,000 words!), we explain why our methodology is the only way to capture zoning rules accurately:
“Keeping AI in its Zone” explains why zoning codes require human interpretation, no matter how “good” AI might get.
“Zoning and Municipal Data Brokers: Toward a Political Economy of Data Slop” explains how other prop-tech entrepreneurs are motivated to deliver as much data as they can — even if it’s bad.
“It’s Time to Retire the Wharton Index” uses our data to prove that a metric upon which researchers, policymakers, and media relied upon for decades (and cited 1,500+ times) is incorrect.
We maintain the highest data standards.
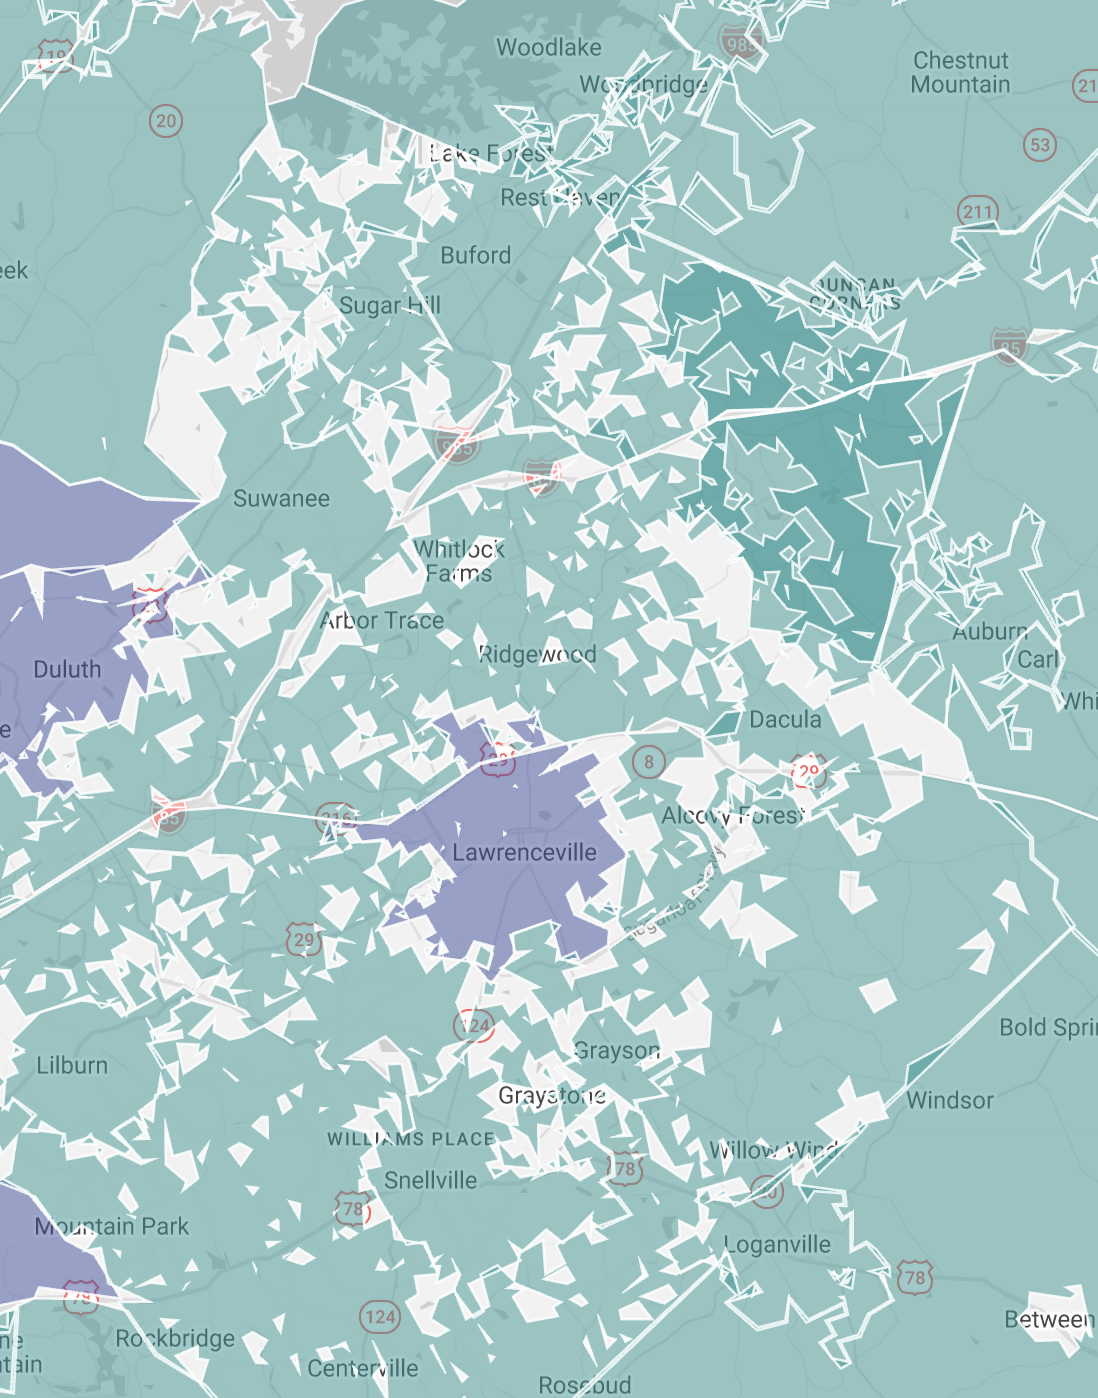
Other zoning datasets on the market are riddled with errors, omit key zoning components (like overlays), and use AI to assemble information.
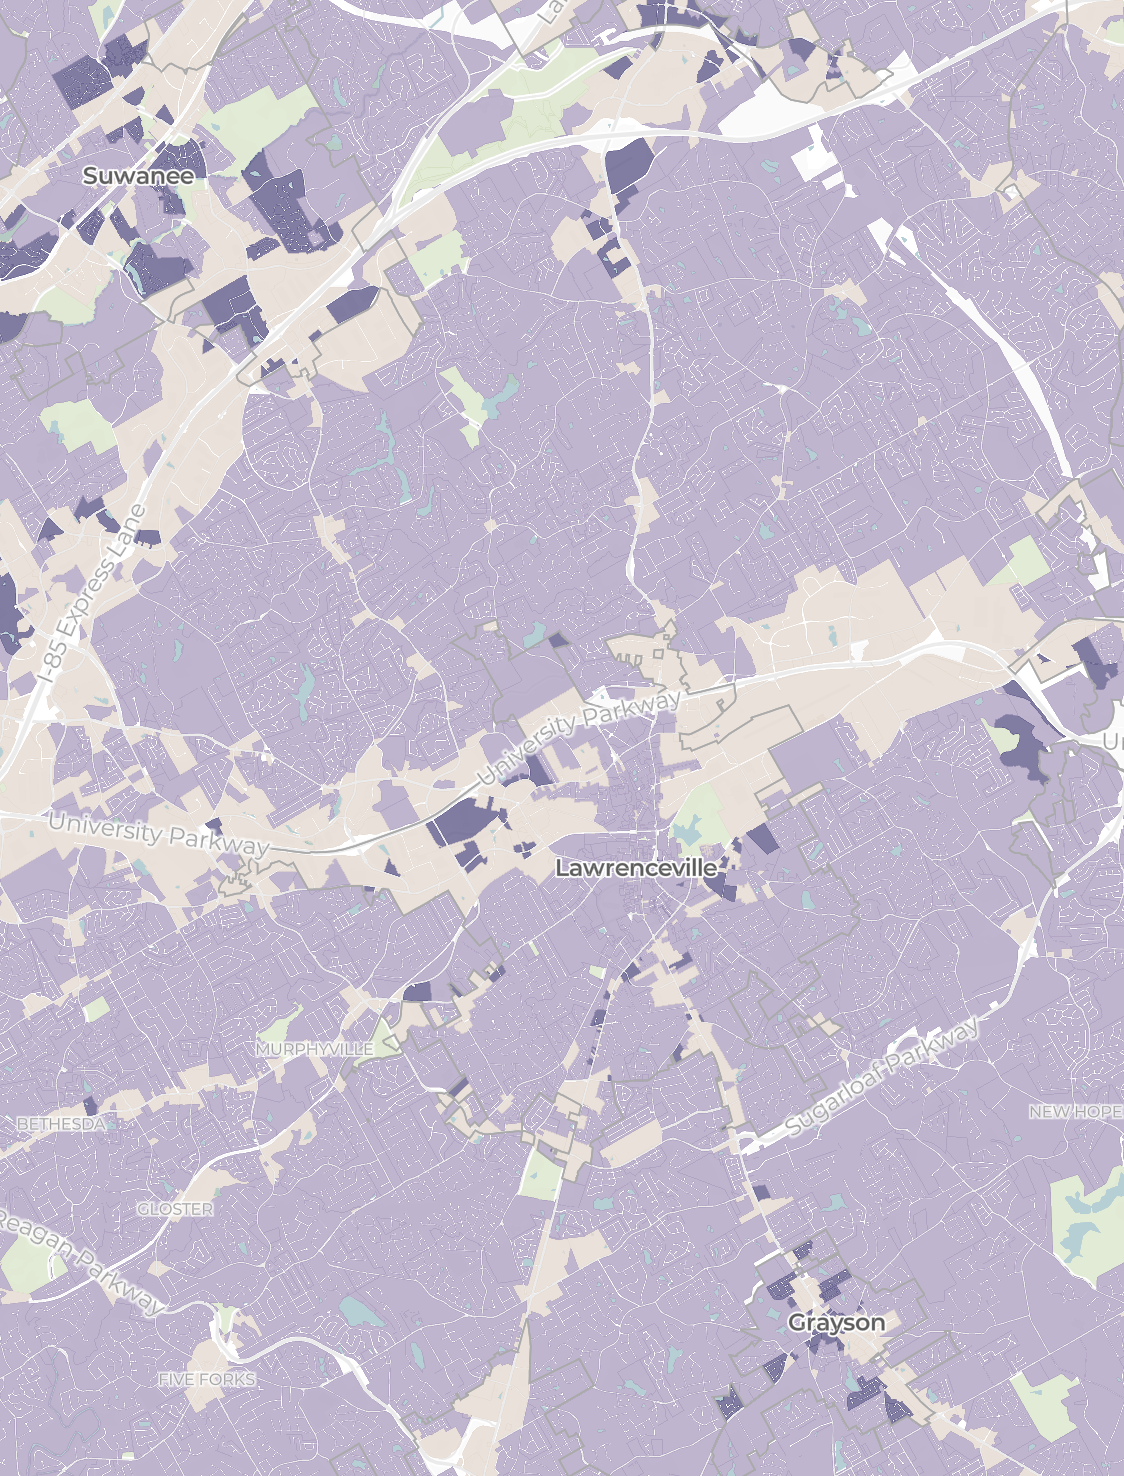
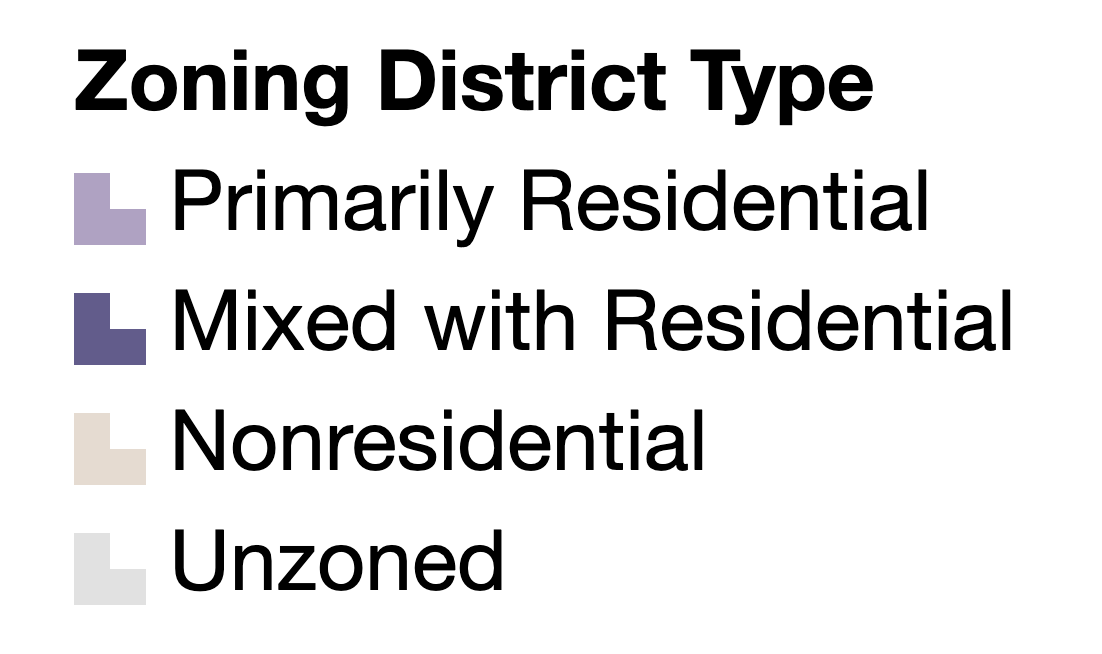
Check out these maps of the Atlanta metro area - with a competitor's broken map versus our fully-analyzed map. Our maps don't have random white space, because we use humans - not AI - to review, confirm, and reconfirm the zoning status for each and every parcel.

And you benefit.
Now check out these stats from a competitor about the percentage of land zoned for residential uses in LA, versus our stats:
Zoneomics claims
11.5%
The truth
90%
We know we’re right because we put in the work analyzing every word in the Los Angeles zoning code. We mapped every district, and we generated Zoning Slices that calculated regulatory truth. We didn’t sit back and ask AI to guess, or generate made-up pie charts.