
Zoning Tables
Zoning Tables provide a database of summary statistics for nearly fifty land cover, demographic, housing, and zoning characteristics at your chosen geographic level.
WHAT ARE ZONING TABLES FOR?
Cross-Geography Comparison · Data Visualization · Housing Research
Regulatory Summaries · Zoning Reform Advocacy
Our data’s now on the Table!
Zoning Tables present data found in the National Zoning Atlas Zoning Snapshots in tabular format at four different geographic scales (or custom geographies).
-
Counties
Core-Based Statistical Areas (i.e., metropolitan and micropolitan areas)
States
Custom: Need our Zoning Table data in a geography not mentioned? Let us know!
-
Jurisdictions
Census tracts
Block groups
Zip codes
Custom: Need our Zoning Table data in a geography not mentioned? Let us know!
-
Zoning Tables include information about:
Each geography’s population, land area, number of housing units, and number of group quarters
Number of zoning districts and pages in the zoning code
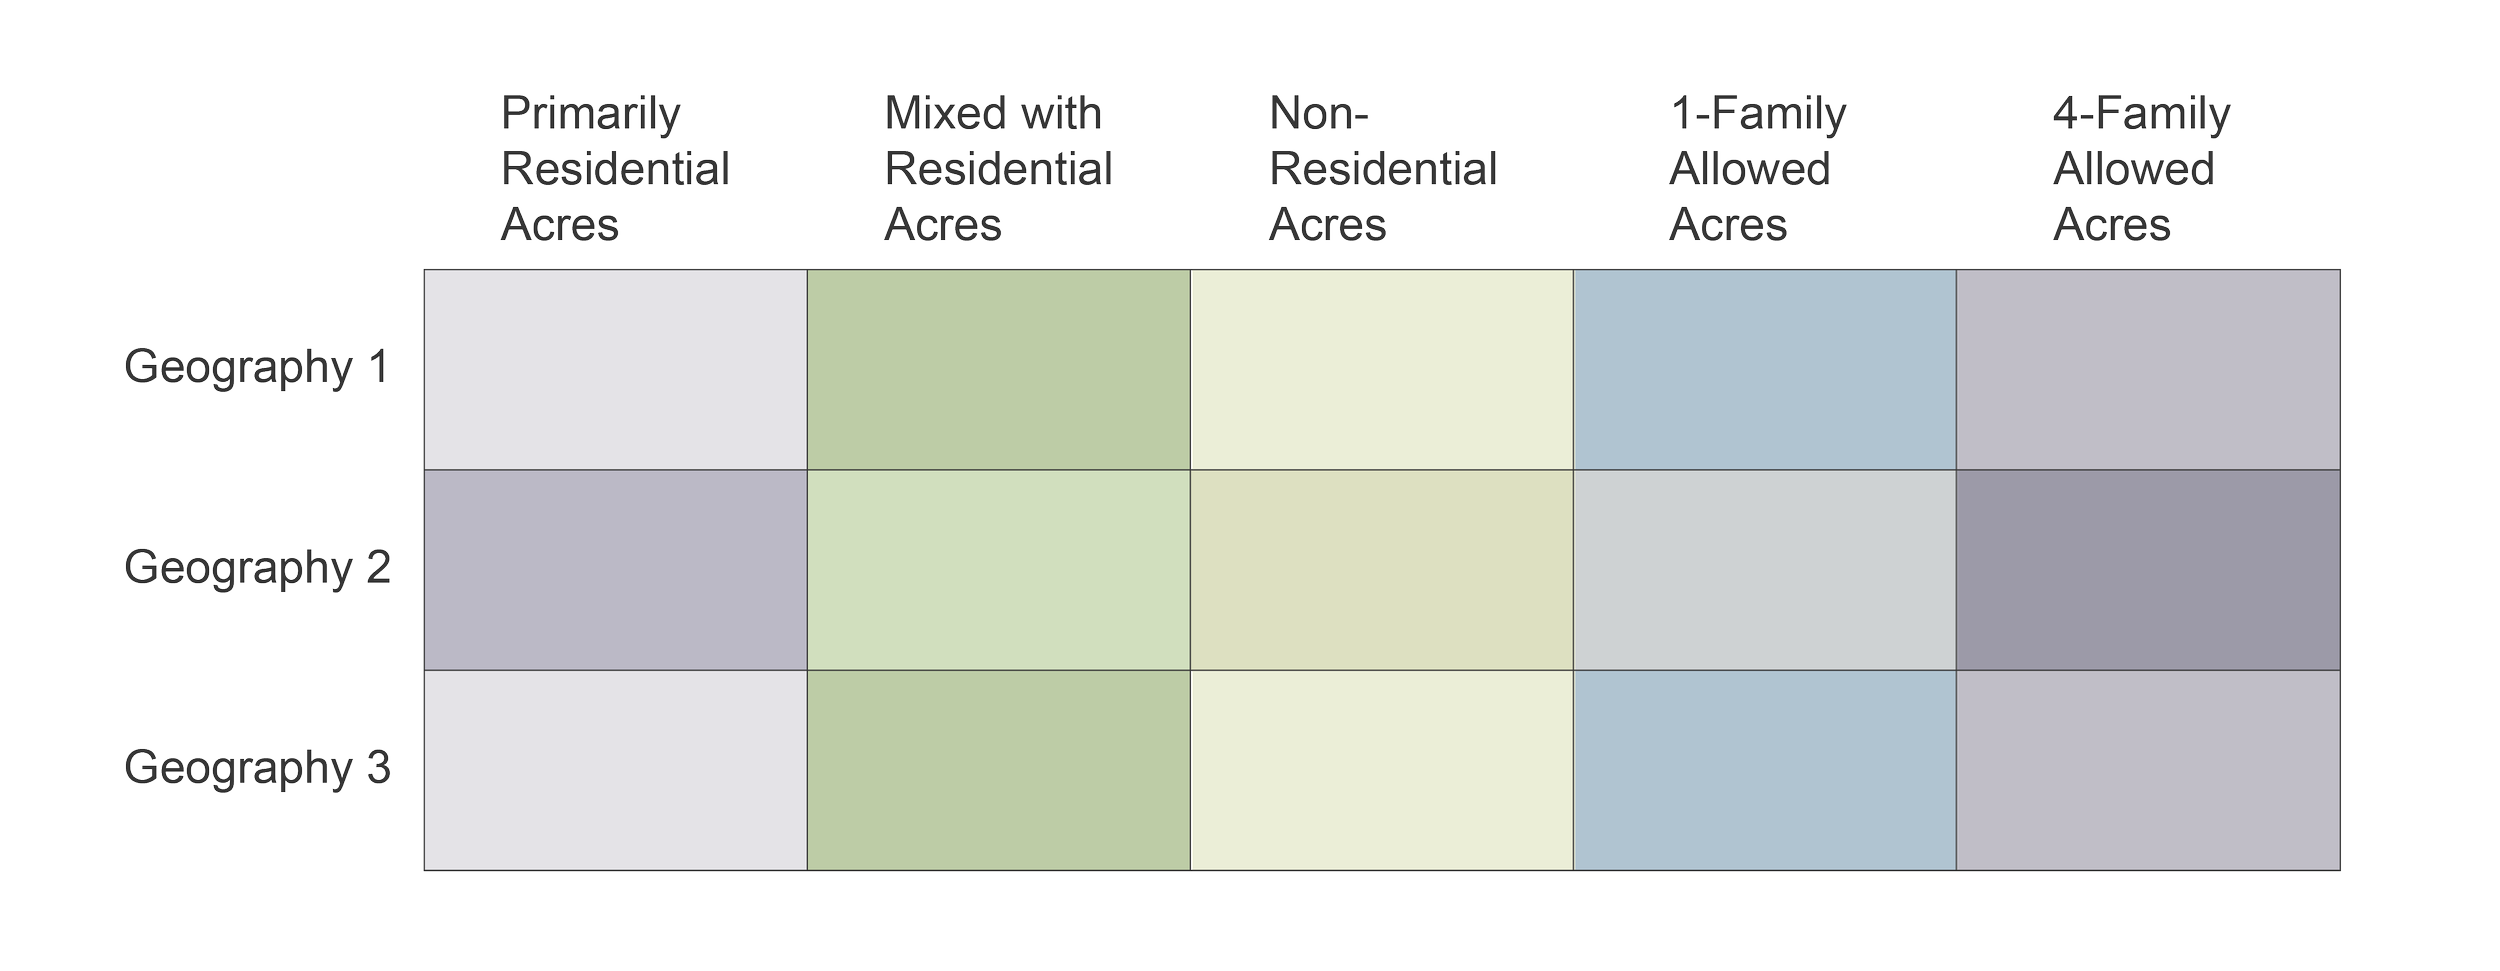
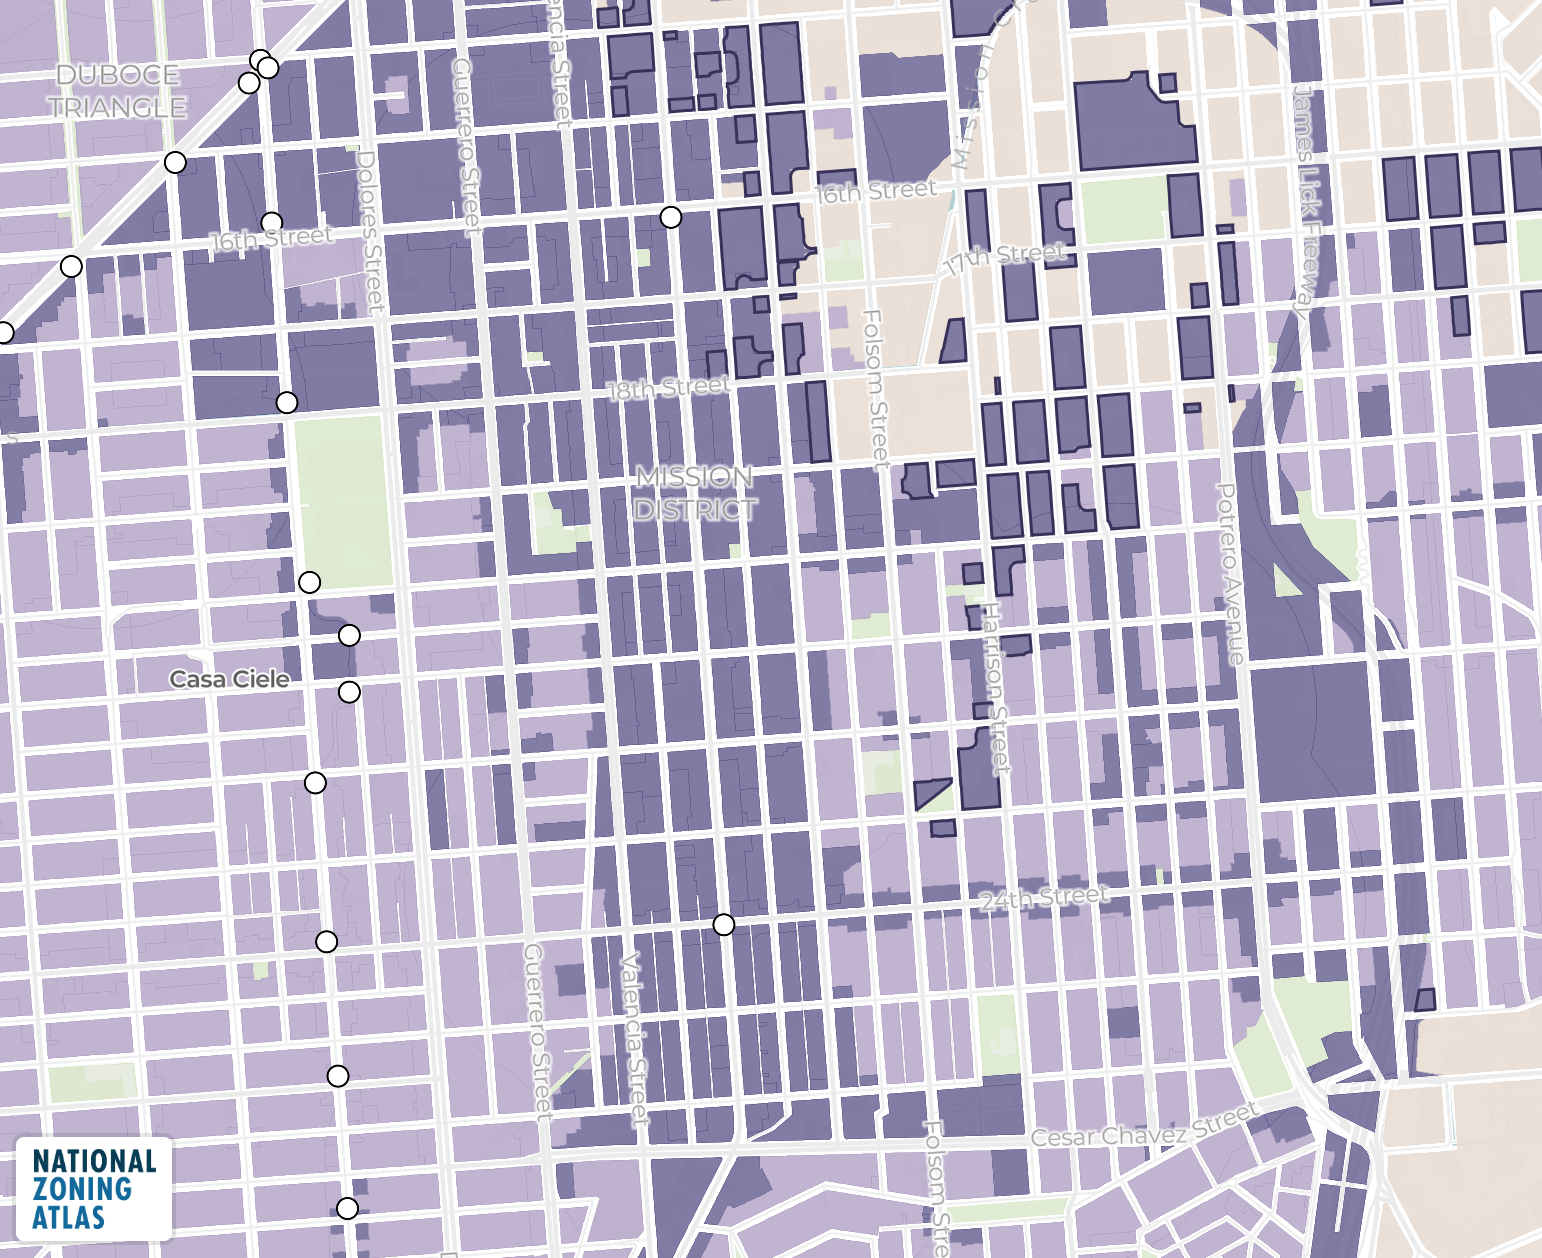
Land area within the jurisdiction devoted to:
Specific land categories (zoned, protected, unzoned, and unzoned Tribal land)
Primarily Residential, Mixed with Residential, and Nonresidential zoned land
Housing units allowed (by right, after a public hearing, and prohibited/not mentioned)
Minimum lot sizes on single-family land
Accessory dwelling unit permissions on single-family land
Residential parking mandates
Need a zoning statistic not listed here? Let us know!
-
CSV
GeoPackage, GeoJSON, or Geodatabase (with geospatial add-on)
Interested in Zoning Tables?
Enter a name, then select from the results below.
Long live accessible zoning for everyone.
By licensing our data, you support the National Zoning Atlas.