
The Difference is in the Data
After analyzing over 1.2 million pages of zoning text, Land Use Labs has developed the expertise needed to deliver the industry's most accurate and comprehensive zoning data. Learn how we catch what other data providers miss.
There are no shortcuts when it comes to data accuracy. That's why our data is triple-vetted.
Every data point we collect benefits from:
1. Interpretation by Human Experts: We don’t rely on AI to read zoning codes. Our zoning and GIS analysts apply a rigorous methodology and use their judgment to translate unstructured texts and maps into a unified dataset. When in doubt, they pick up the phone and call planning staff.
2. Multi-Step Validation: Our data has undergone review by at least three members of our team, whose experience includes law, geography, planning, and data science. Their expertise is the quality control layer that automated tools simply can't replicate.
3. Public Peer Review: The publicly-accessible National Zoning Atlas shows some of the key data points we collect. That transparency isn't just a public service; it enables robust peer review. When local experts contact us to update information, we’re glad to do it.
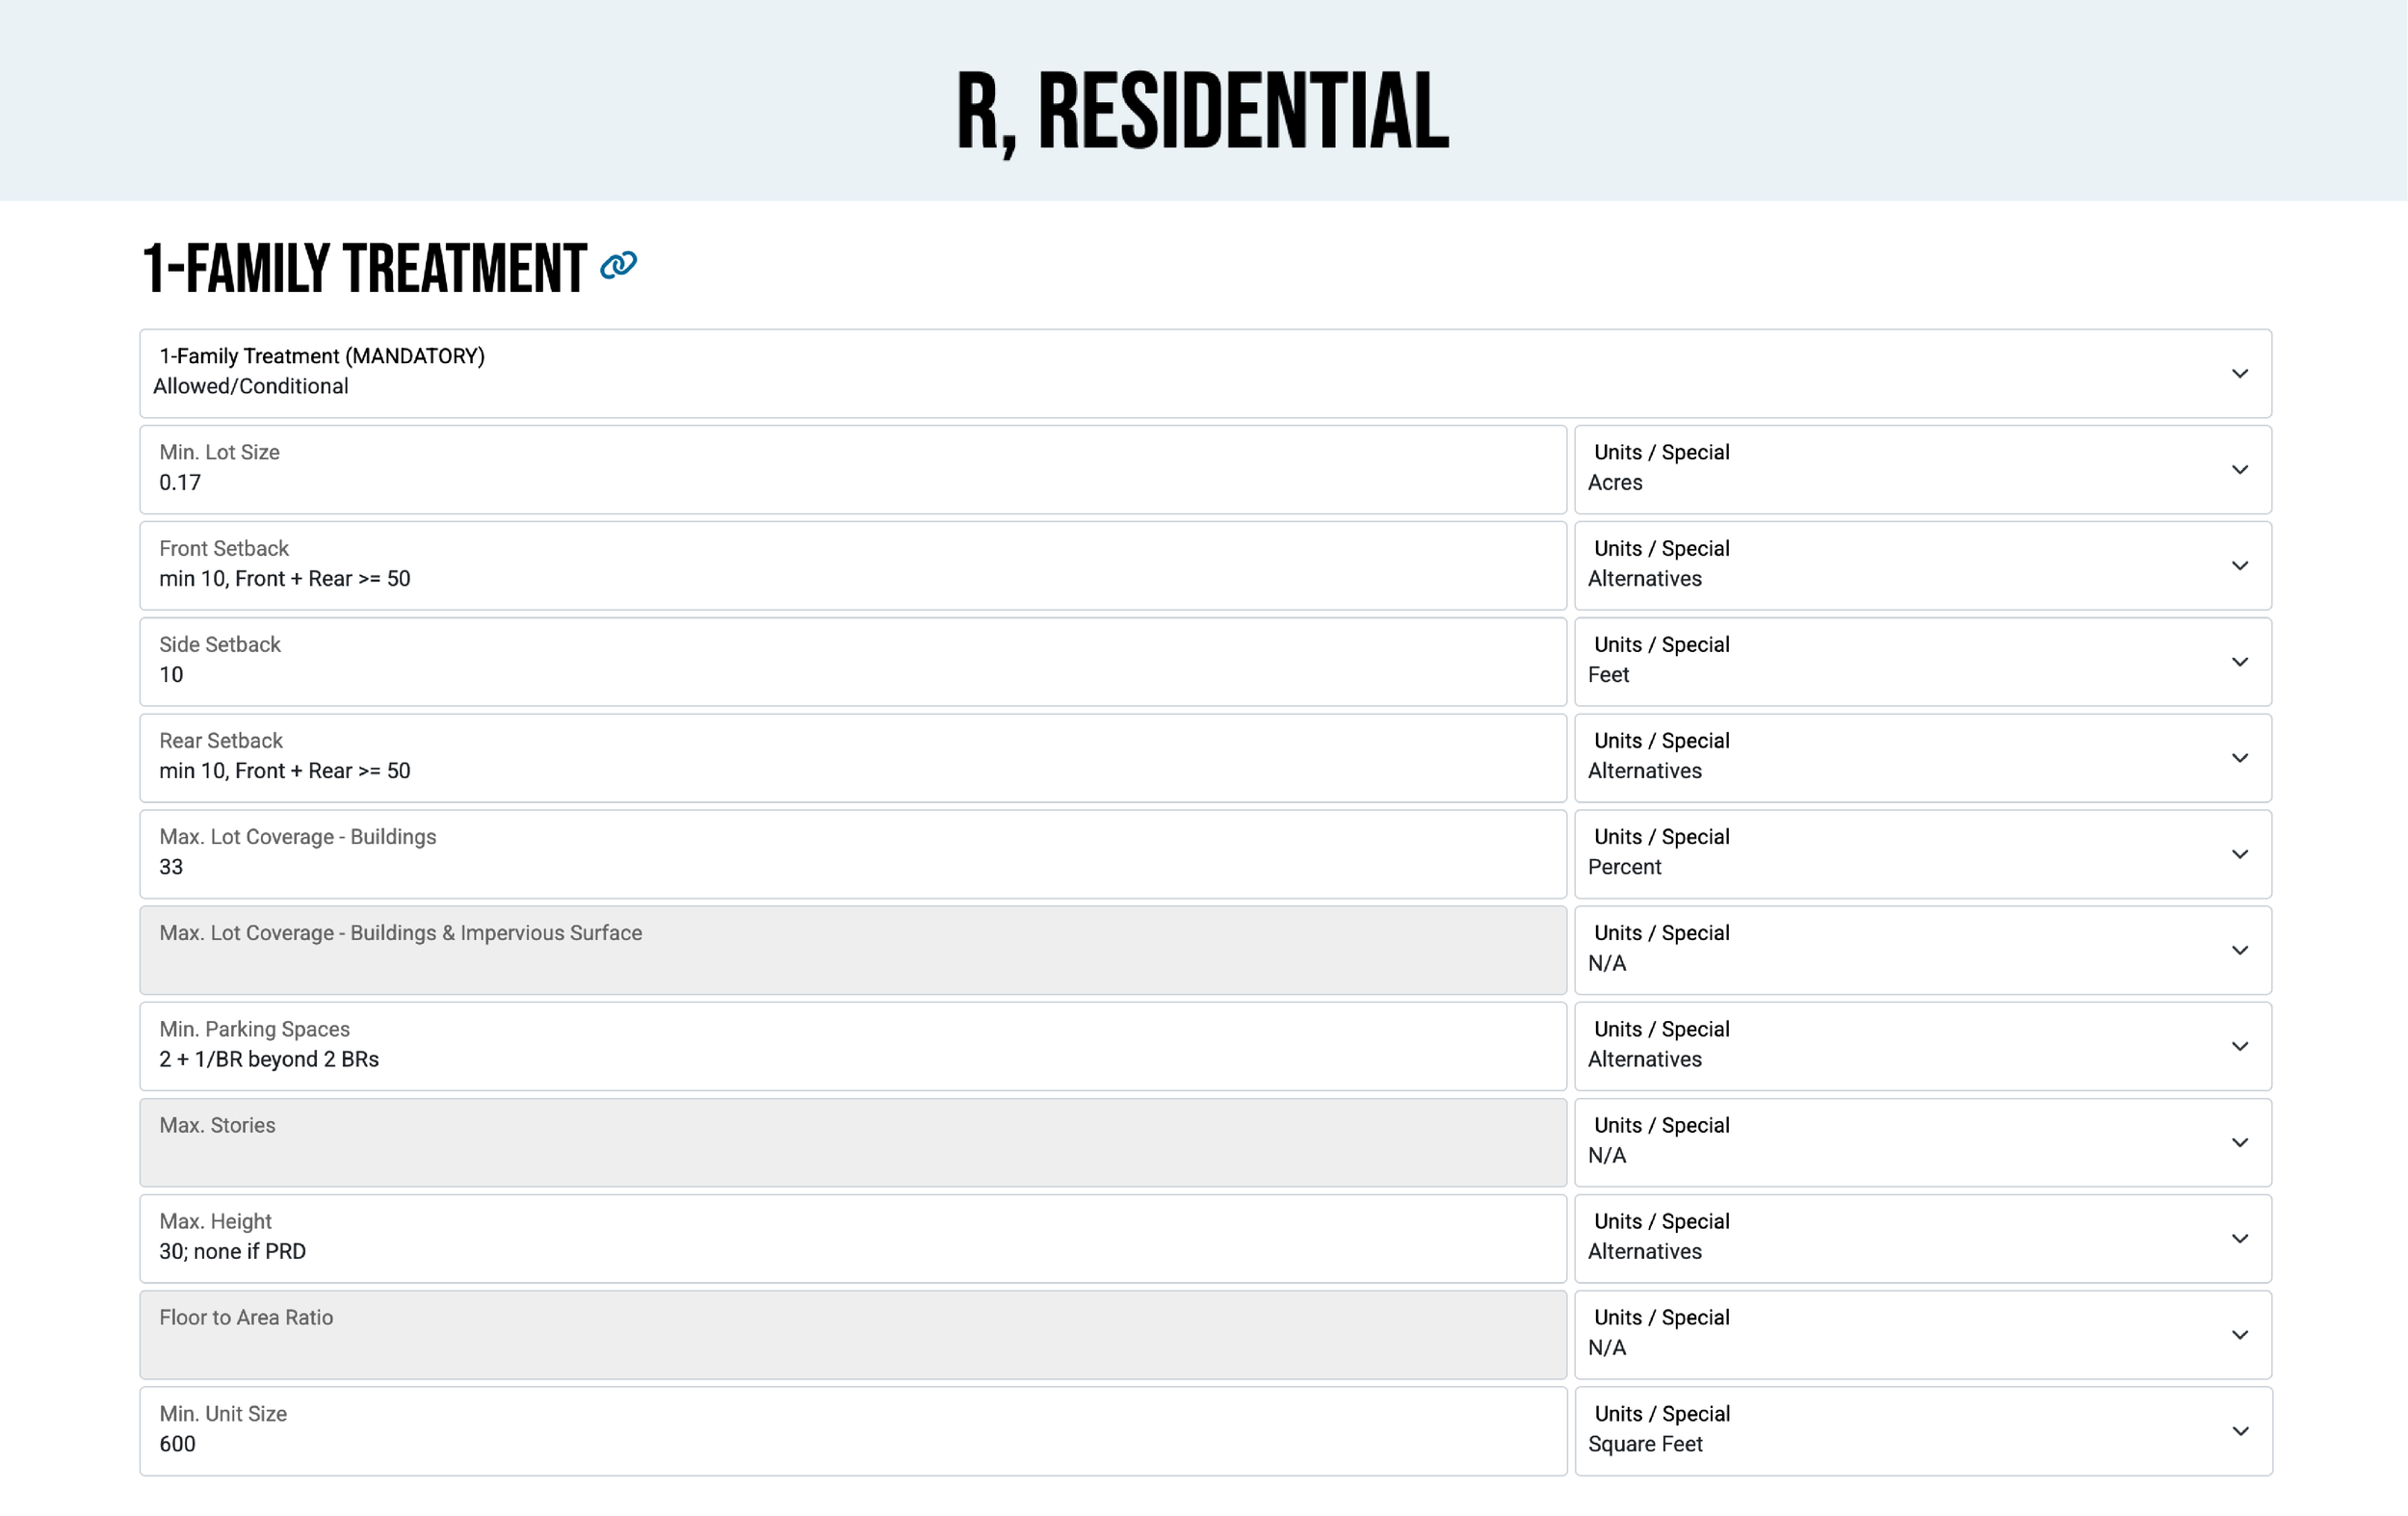
View of the National Zoning Atlas Editor interface, the backend data-collection tool that facilitates standardized data entry per the NZA methodology.
We build our data products from three fundamental components.
Our products are all built from three building blocks: Jurisdictions, Zoning Districts and Zoning Slices. We use a rigorous process to generate them, enabling us to capture how zoning actually works in the United States — use by use, lot by lot, structure by structure.
-
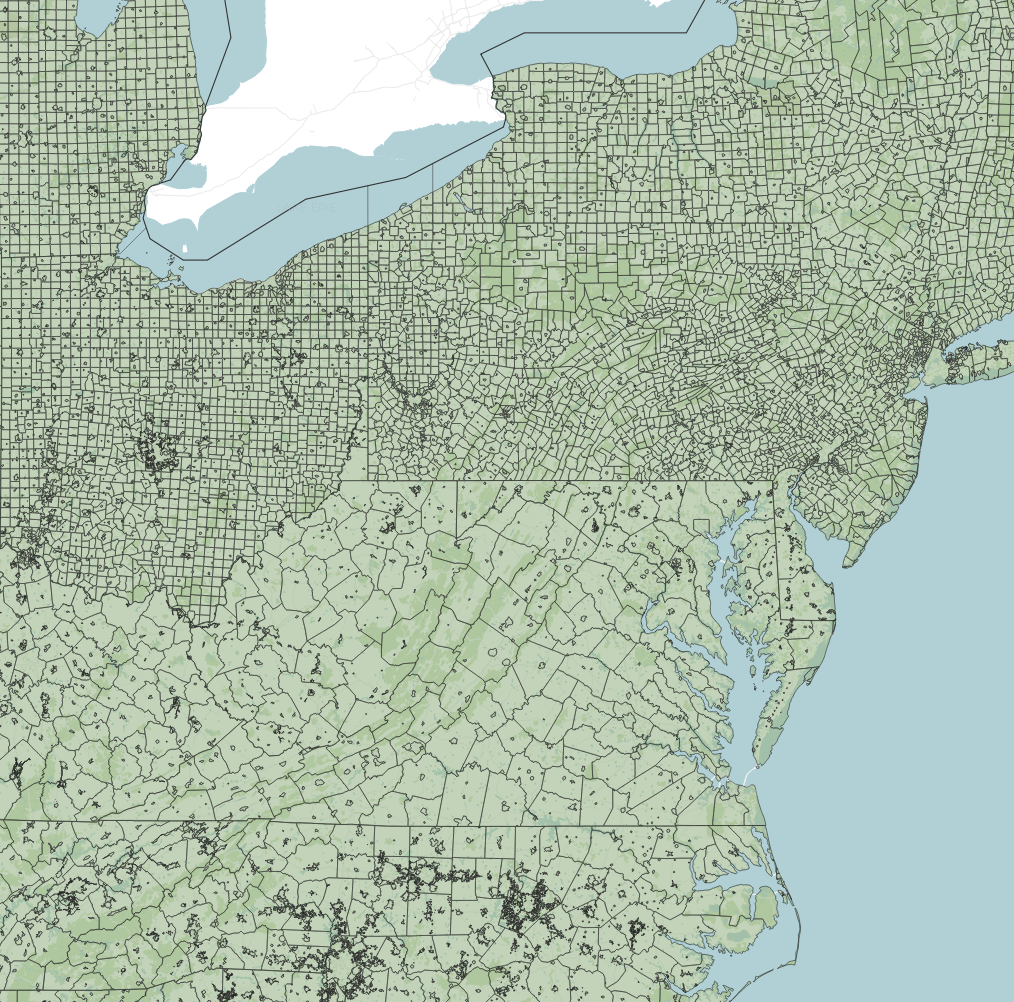
When the National Zoning Atlas began, no one knew how many jurisdictions could exercise zoning in the U.S because there was no centralized national database. So we built one.
Our team stewards the first and only fully integrated dataset that has identified all 33,000+ jurisdictions with zoning authority in the country — complete with their geographic boundaries, population and housing unit counts, and land cover statistics.
-
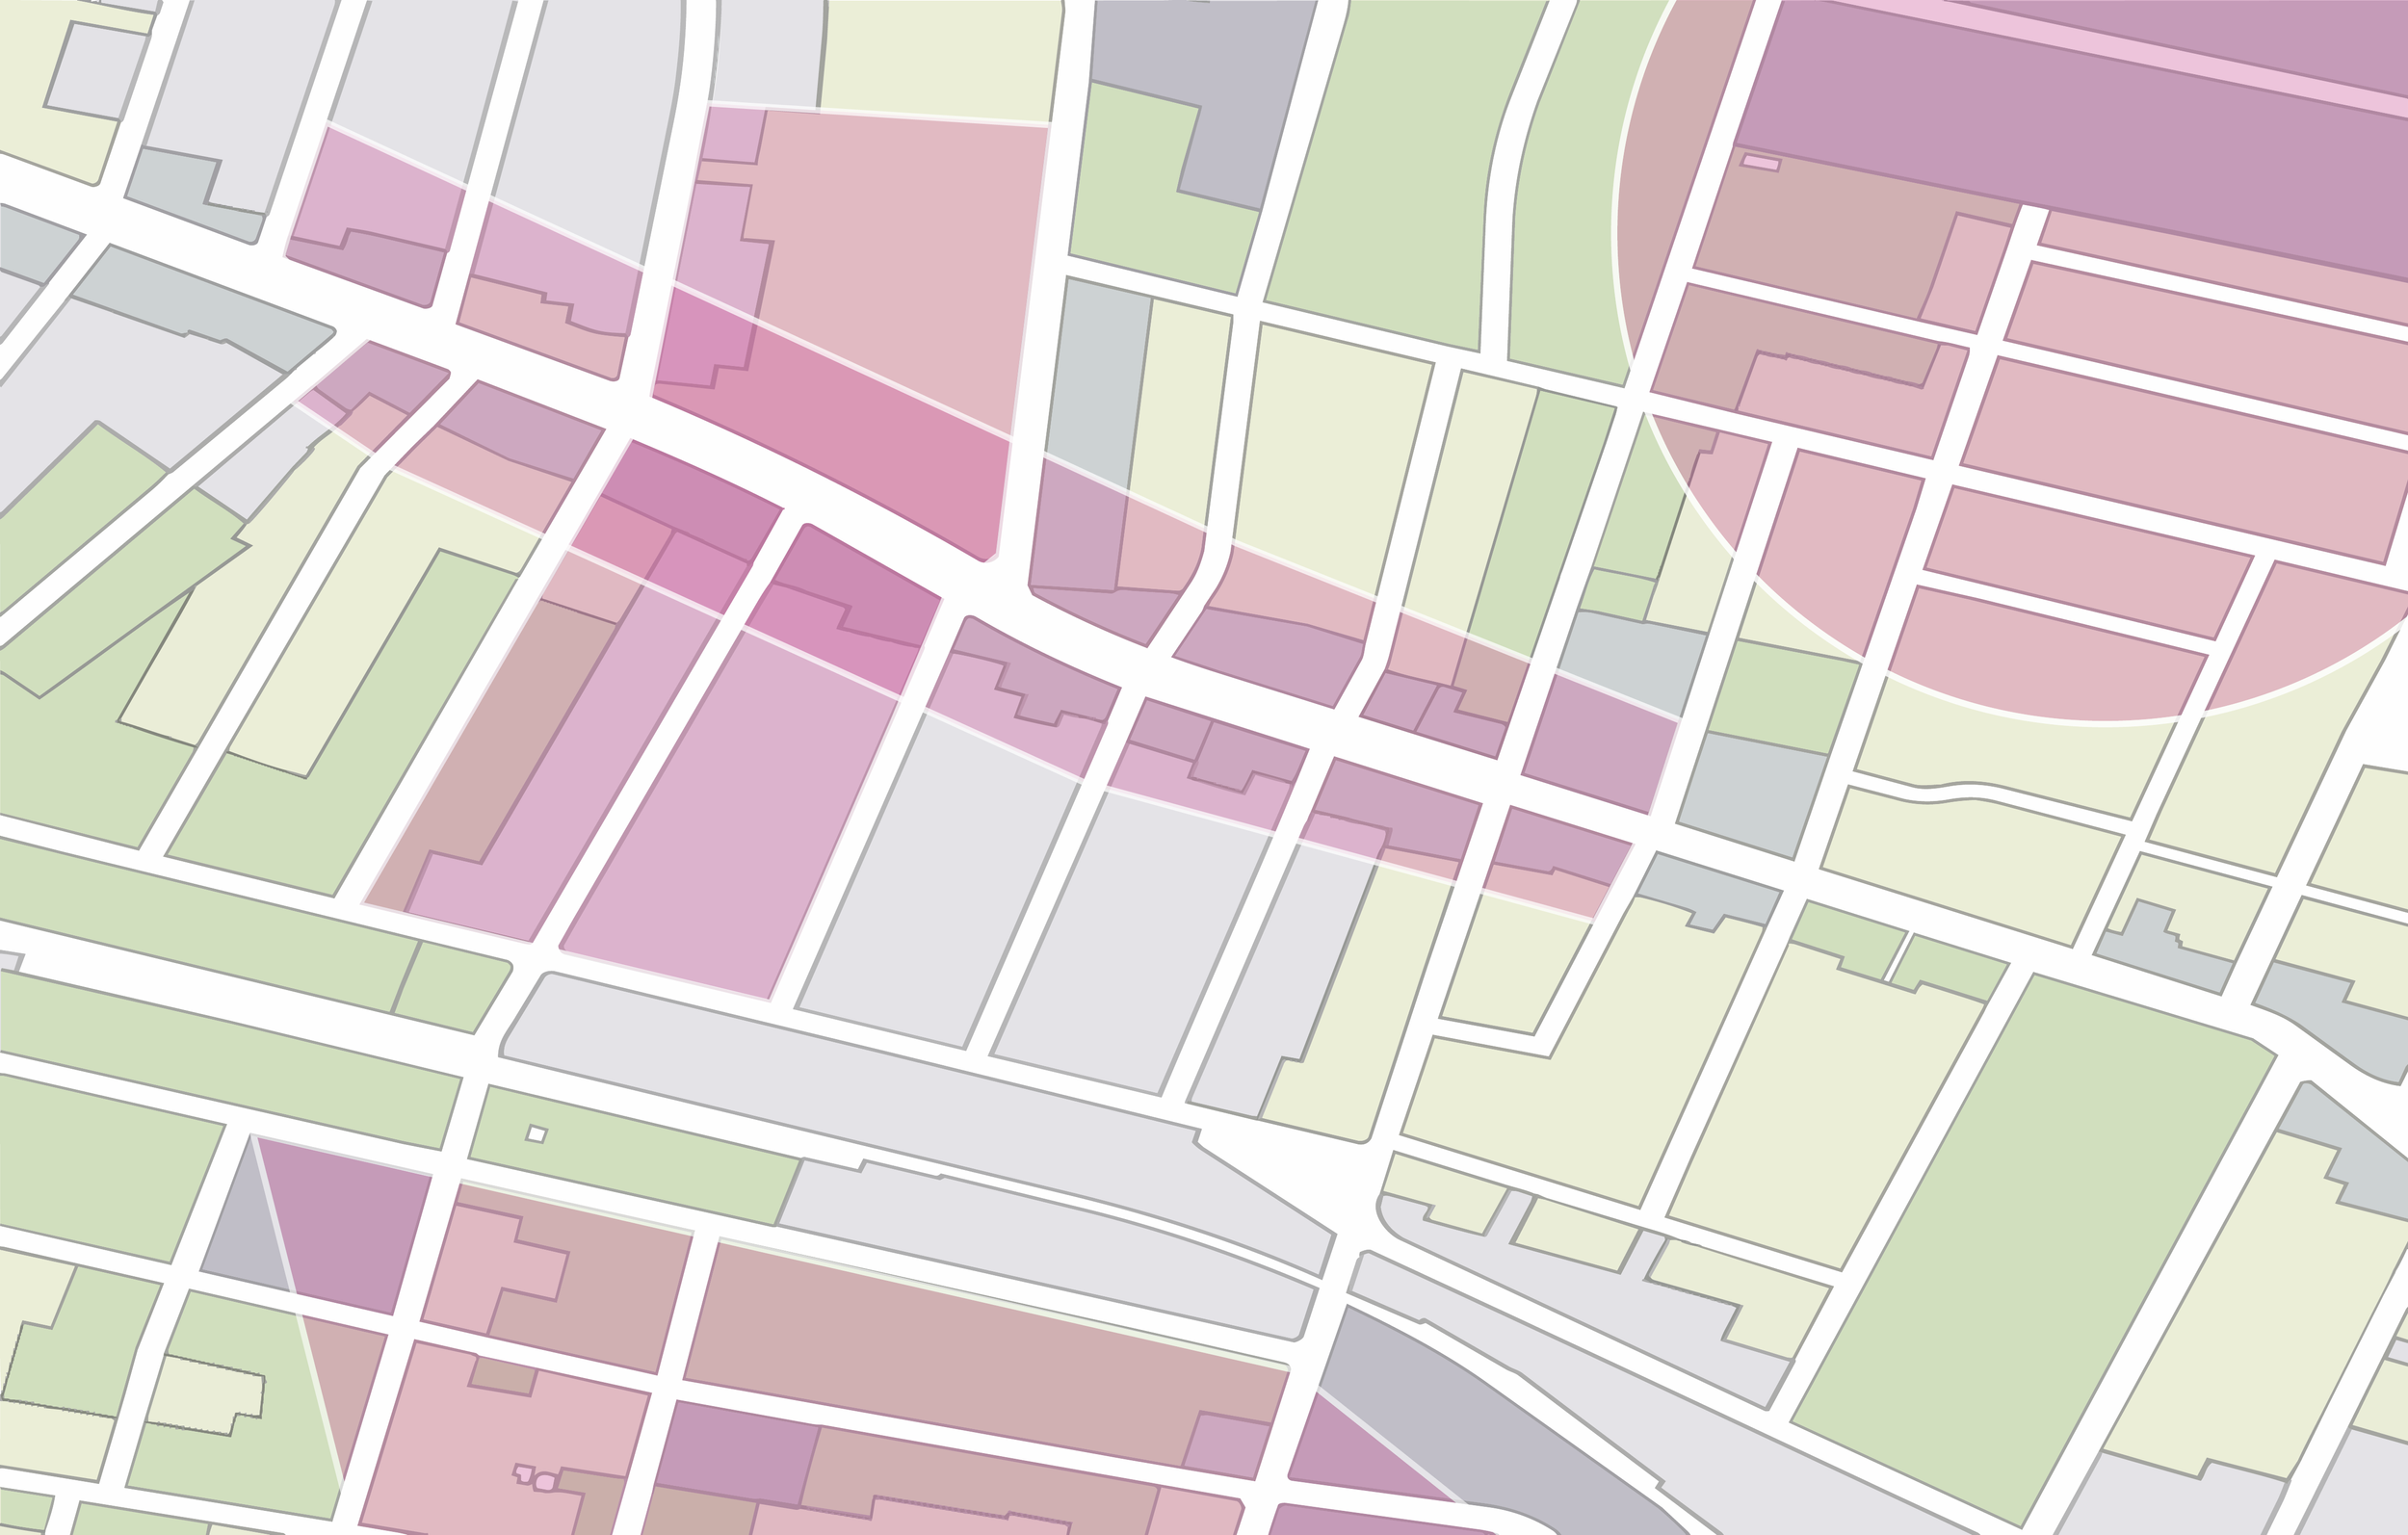
To build Zoning Districts, our team of trained analysts uses a standardized methodology designed to translate complex local regulations into consistent, comparable data. We log that data at the scale of districts: defined regulated areas within (and sometimes outside) the city, town, county, or other type of jurisdiction that administers the zoning code.
We find these districts by painstakingly reviewing the full zoning code: both text and map. Our team digitizes and spatially aligns district boundaries, and encodes regulatory attributes specifying use, lot, and structure requirements into our structured data schema.
Internal reviews confirm alignment between mapped boundaries and written regulations, evaluate data entries for consistency, and document how ambiguities are resolved. Districts are only included in the final dataset after passing these checks.
If you need zoning data to conduct regulatory analysis or do certain types of due diligence, Zoning Districts (our premium product) may be what you’re looking for.
-
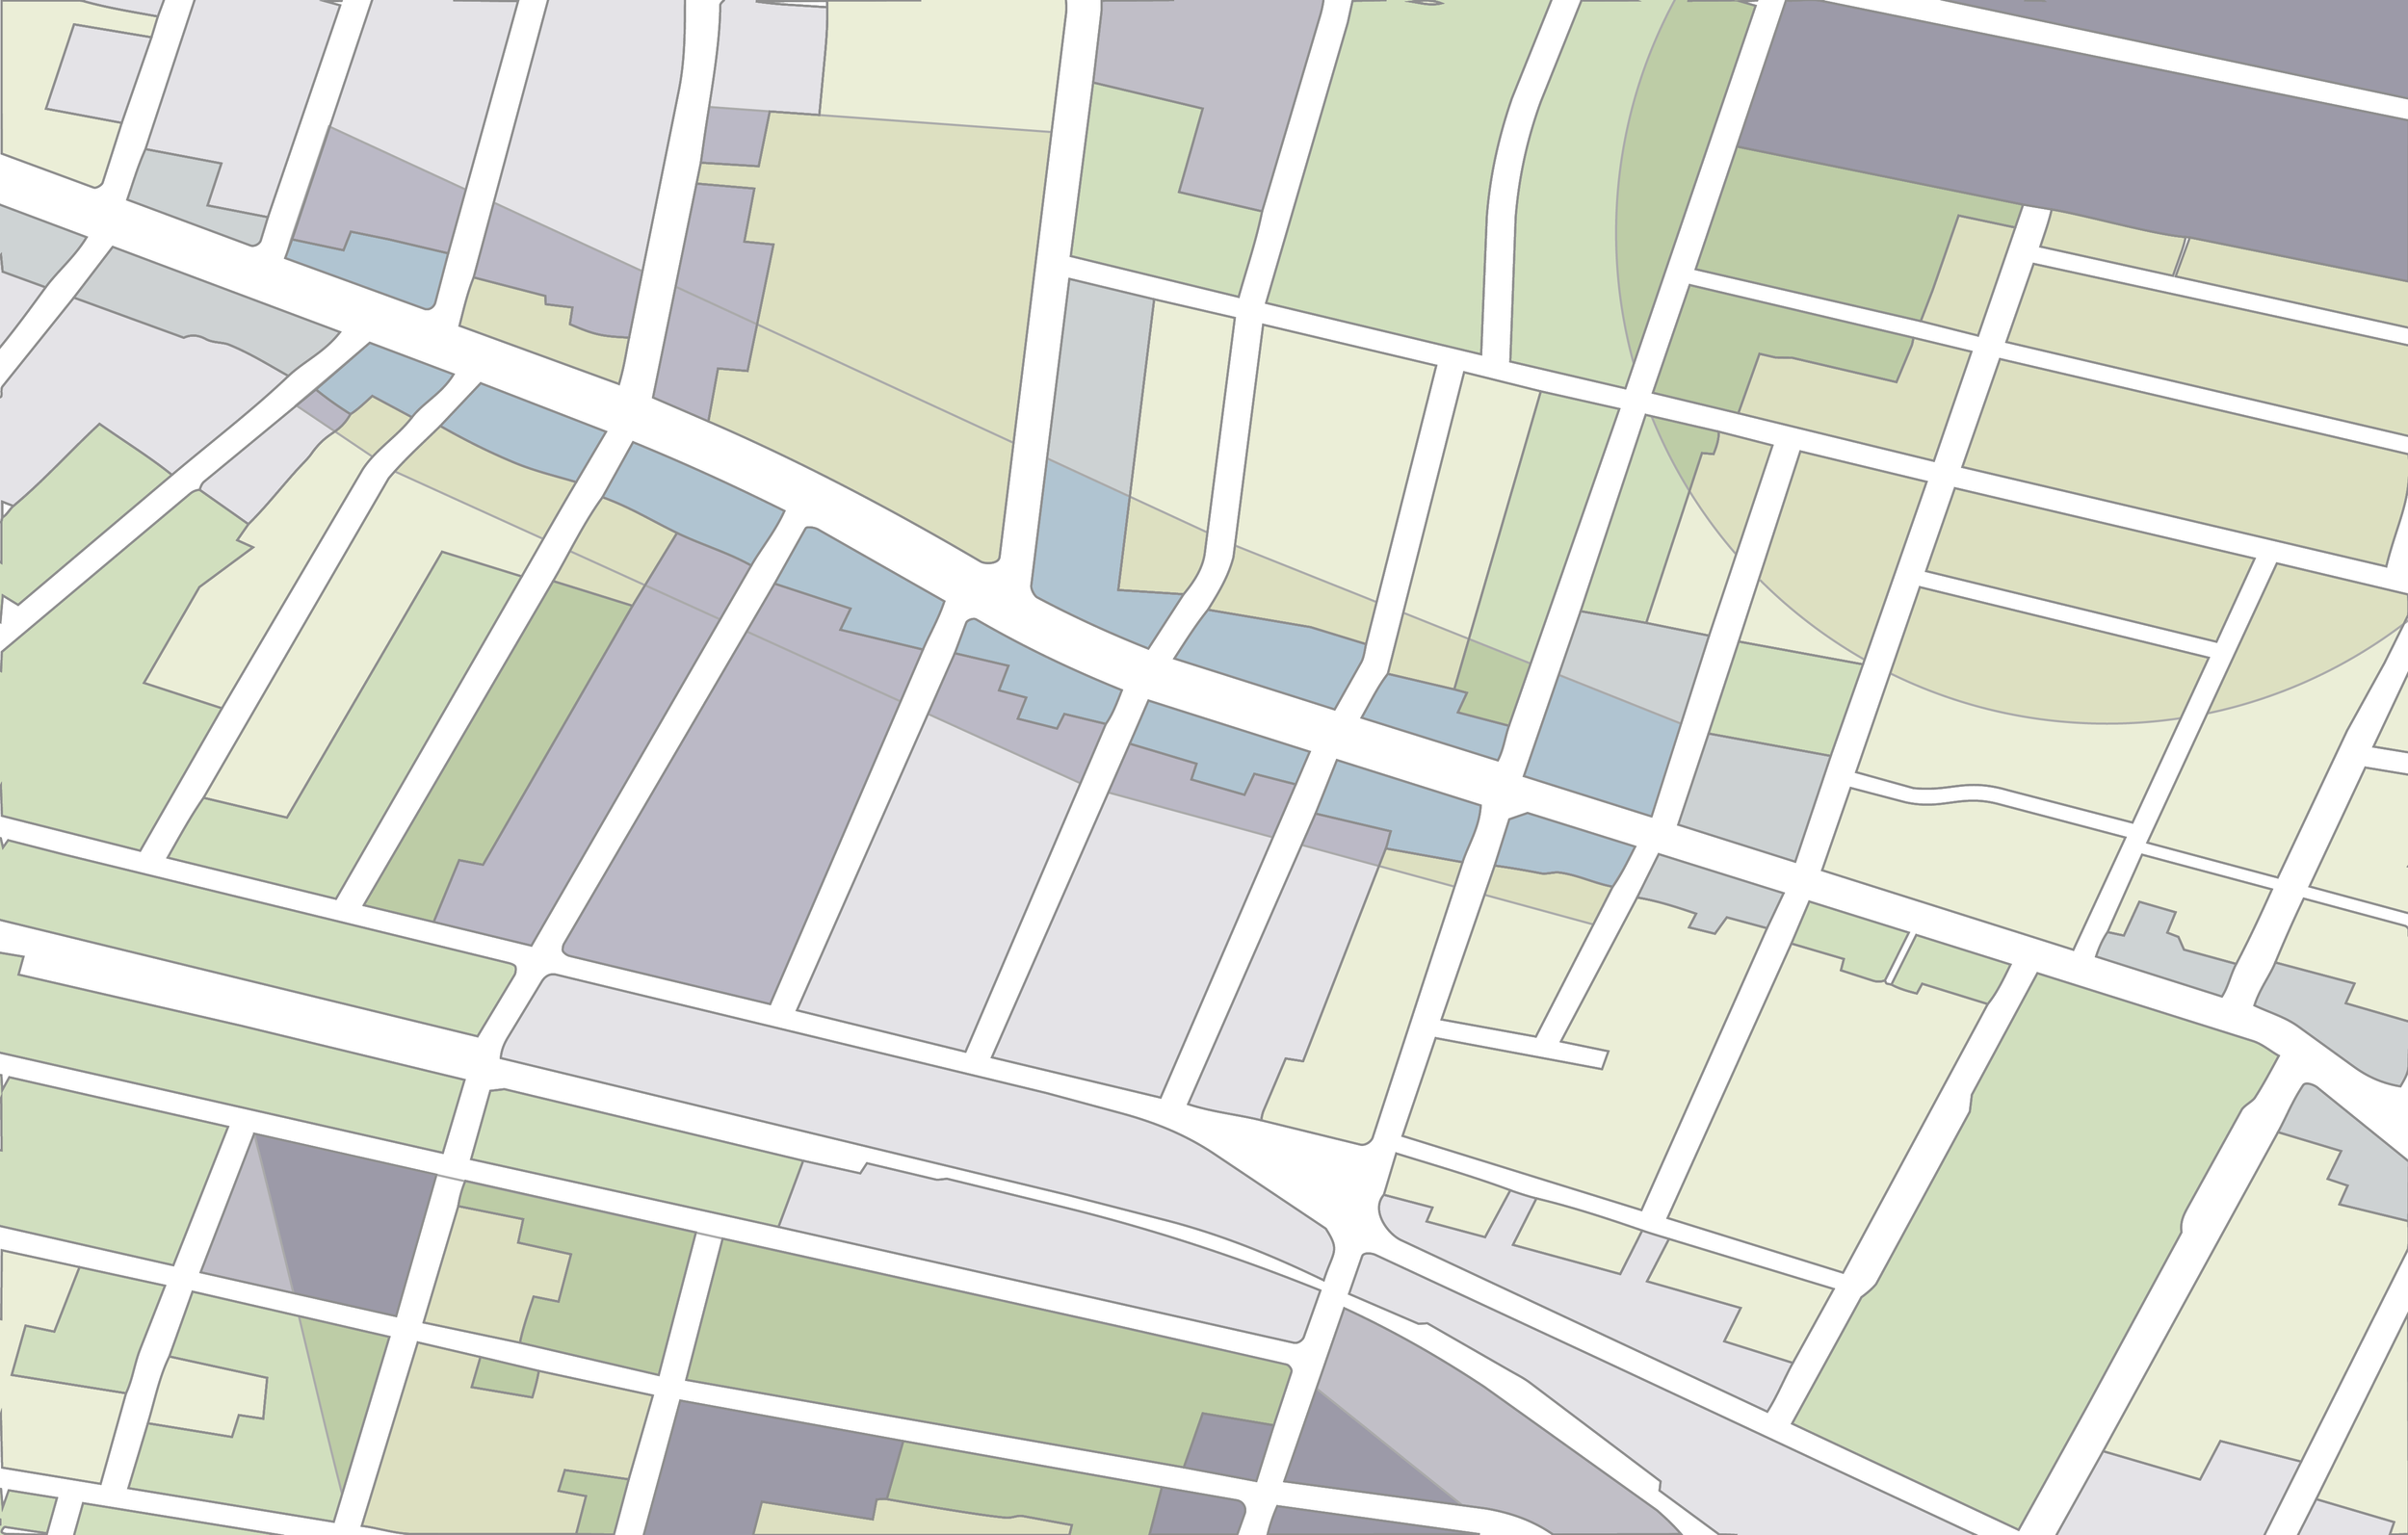
Comparing zoning rules across jurisdictions would be straightforward if districts never overlapped. But they do. Many zoning codes layer base districts and overlay districts on top of one another, so two or more sets of regulations can apply to the same piece of land at once. Ignoring that complexity doesn't simplify analysis. It breaks it.
Zoning Slices are Land Use Labs’s solution to this problem. A Slice is the unique geometric combination of base and overlay districts that reflect how zoning rules actually operate. Our Zoning Slices product applies our tested processes to show regulatory outcomes. The output appears like a stained-glass mosaic, where each Slice represents a distinct set of zoning rules that apply to the underlying land.
If you need zoning data to calculate area statistics, run comparative analyses, or conduct scenario planning, Zoning Slices are what you're looking for.
We don’t settle for data slop. Neither should you.
Other large-scale zoning datasets on the market today are riddled with errors: frankly, they’re slop. Take this graphic on the left showing the “Land Allocation Breakdown” in Los Angeles published by a major zoning data provider.
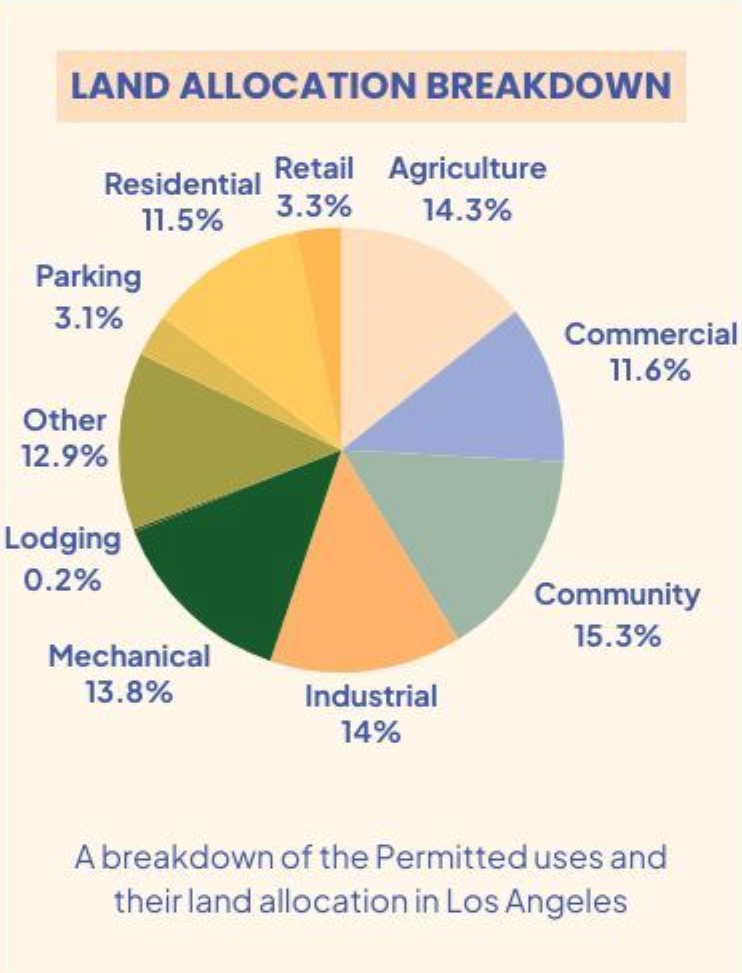
Data visualization of Los Angeles zoning from another zoning data provider.
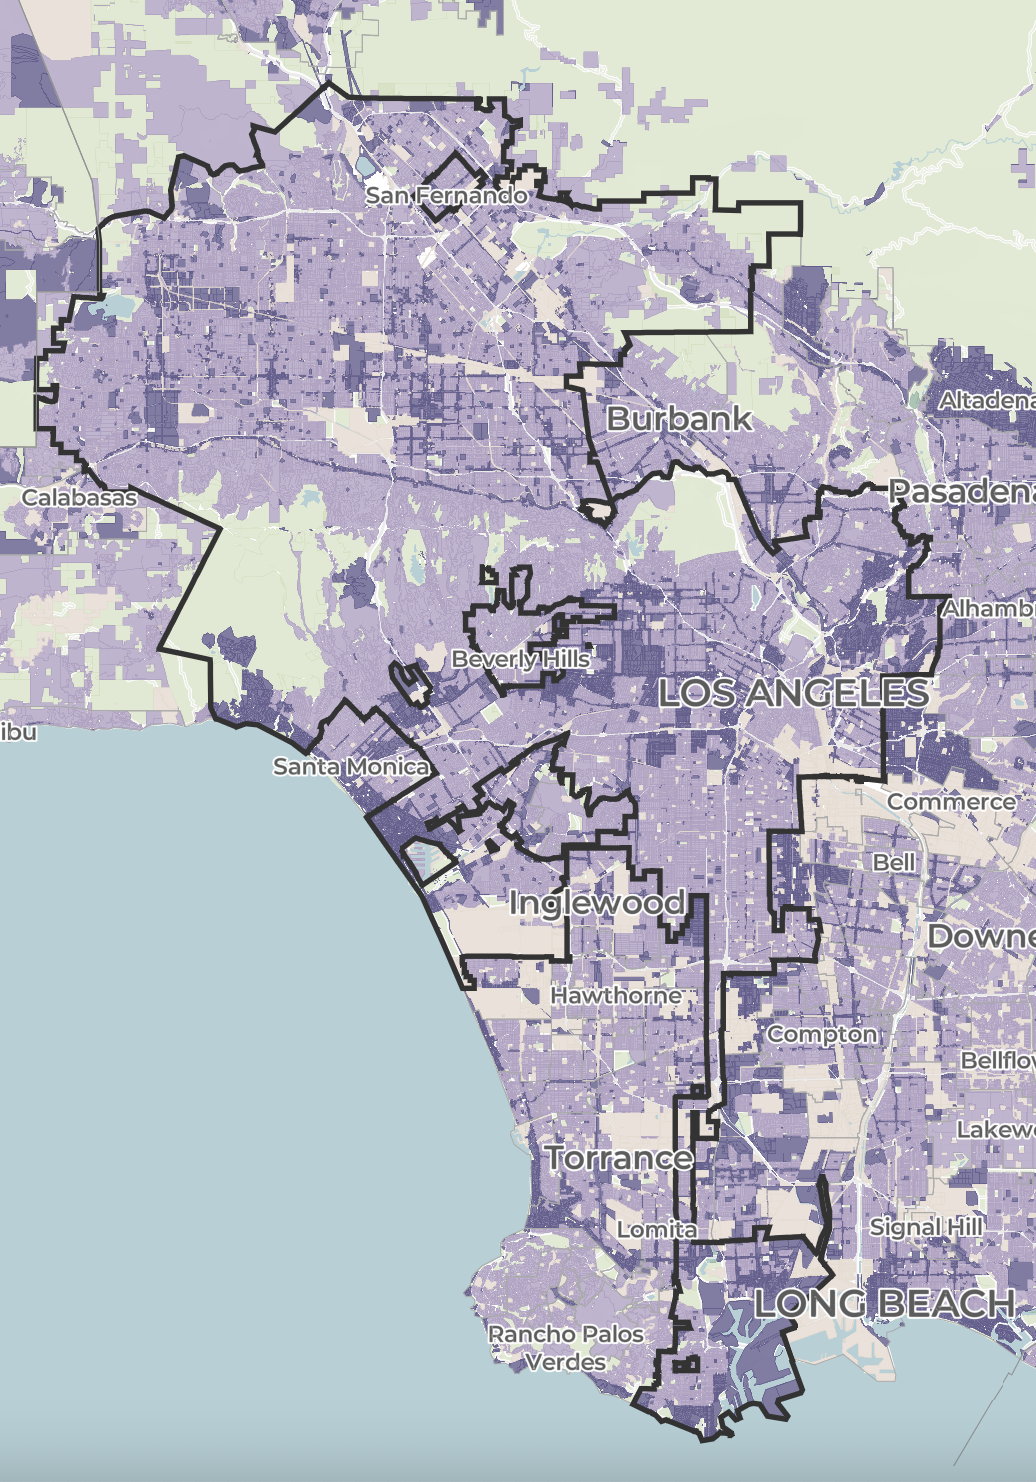
Residential land in Los Angeles shown in purple on the National Zoning Atlas.
Anyone familiar with zoning can immediately spot the problems. For one, zoning districts allow multiple uses, so this pie chart just doesn’t compute. For another, even a newcomer visiting Los Angeles for the first time can see the city — the second largest in the country — allows people to live on more than 11.5% of its zoned land.
In reality, Los Angeles allows residential uses on nearly 90% of its zoned land, as shown by all the purple in the National Zoning Atlas image above. We know what and where those are because we put in the work. We didn’t sit back and ask AI to guess, or generate fictitious land-use pie charts. We read the code, mapped the districts, and sliced the data.
Long live accessible zoning
for everyone.
By licensing our data,
you support the National Zoning Atlas.
Learn More.